Data quality · BI
Data quality dashboard demo
Processing, quality and source availability measures, a region × domain matrix, a PDF report and your own CSV right in the browser.
Interactive demos on synthetic data, learning games about data and real problems I have worked on. New demos are added step by step.
Processing, quality and source availability measures, a region × domain matrix, a PDF report and your own CSV right in the browser.
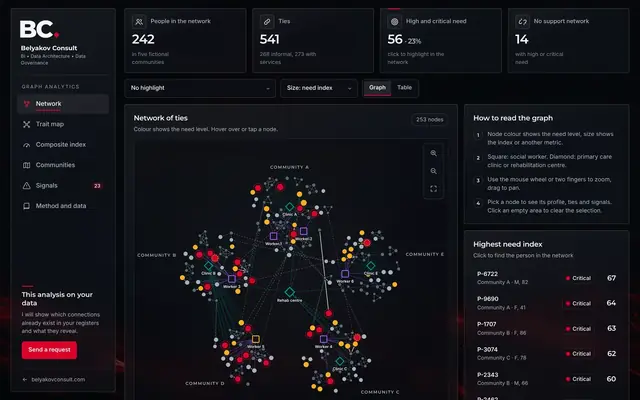
A network of people, households, social workers and clinics, a composite need index and signals for social work.
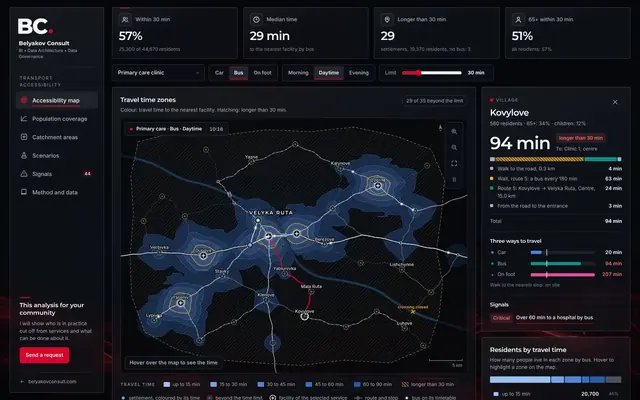
Isochrones to primary care, a hospital and a service centre, population coverage, catchment areas and network scenarios.
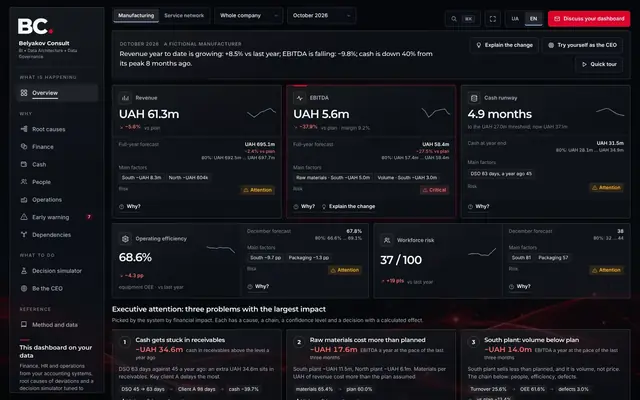
What is happening, why and what to do: measures with a forecast, an EBITDA root cause tree, cash flow, early warning, a decision simulator and a Be the CEO challenge.
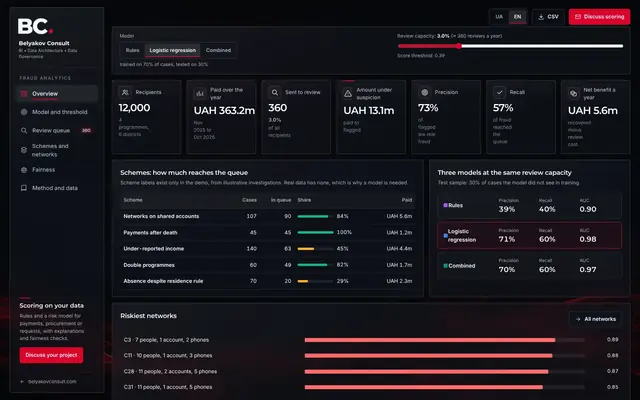
Rules against logistic regression, threshold and review capacity, an explained review queue, networks on shared accounts and model fairness.
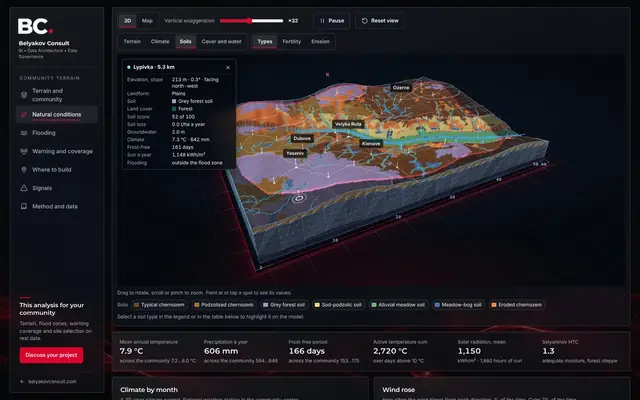
Community terrain in 3D: flood zones, warning and coverage, climate, soils, erosion and groundwater, site selection for new facilities.
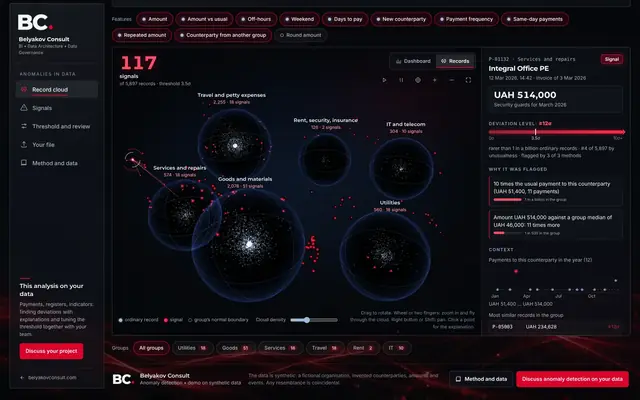
A 3D cloud of almost 6,000 payments: anomalies a dashboard cannot show, an explanation for every signal and a search in your own file.
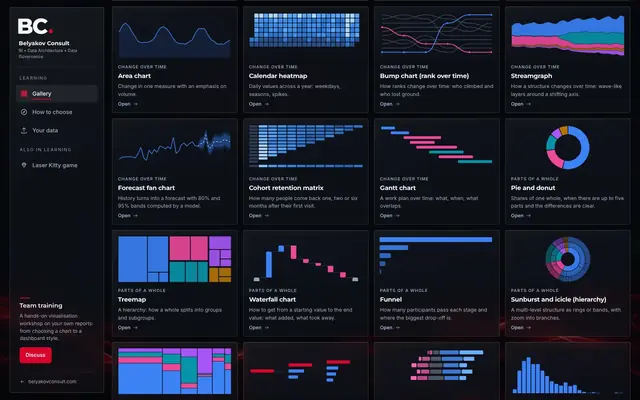
42 chart types: when to use which, how to prepare the data, Excel samples and a chart built from your own file.
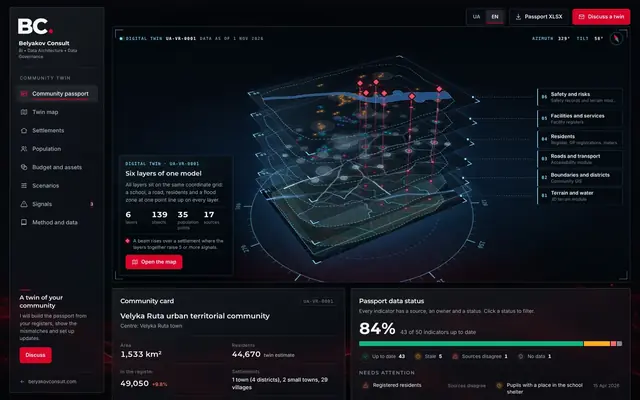
A community passport that updates from registers: 50 indicators with data status, every facility on the map, the real resident count and school, blackout and flood scenarios.
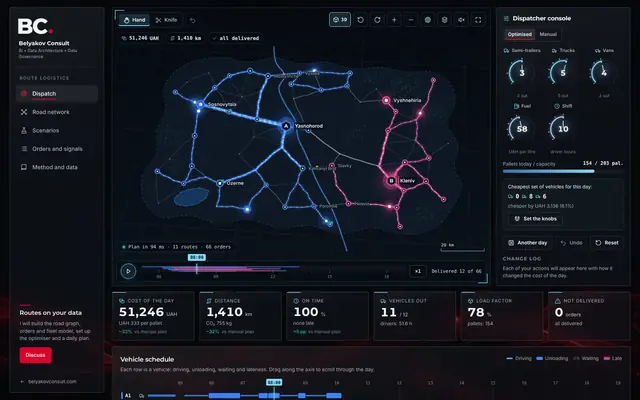
A road graph, a map and an optimiser: drag a depot, slice a road, turn the fleet knobs and the routes rebuild in milliseconds.
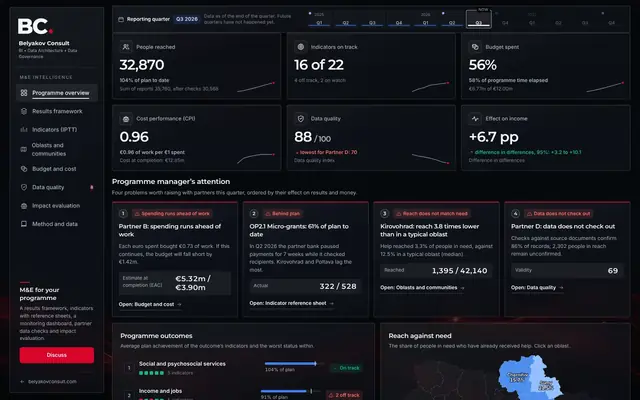
A results framework, 22 indicators with forecasts, money against work done, partner data checks and an honest impact estimate: three ways to count give +13, −1 and +7 pp.
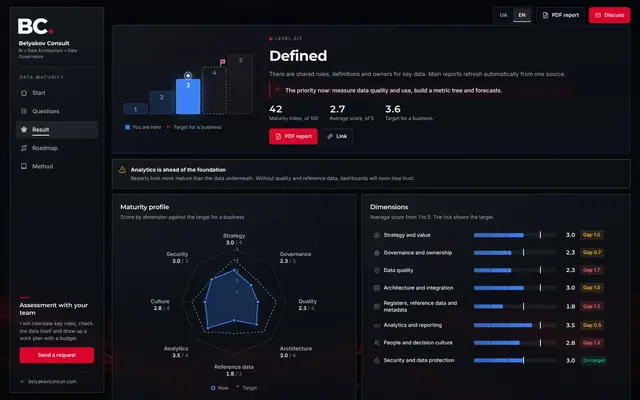
32 questions in eight dimensions: a maturity level from 1 to 5, your profile against a target, priorities, a 30, 90 and 180 day roadmap and a PDF report. Your answers stay in your browser.
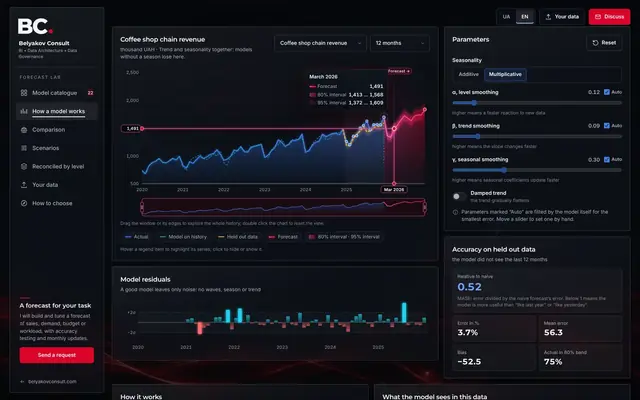
22 models from the naive forecast to Prophet, SARIMAX and boosting with SHAP: how each one works and where it fails, scenarios, reconciliation by level and a forecast on your own file in the browser.
Nothing found. Try another word or reset the filter.
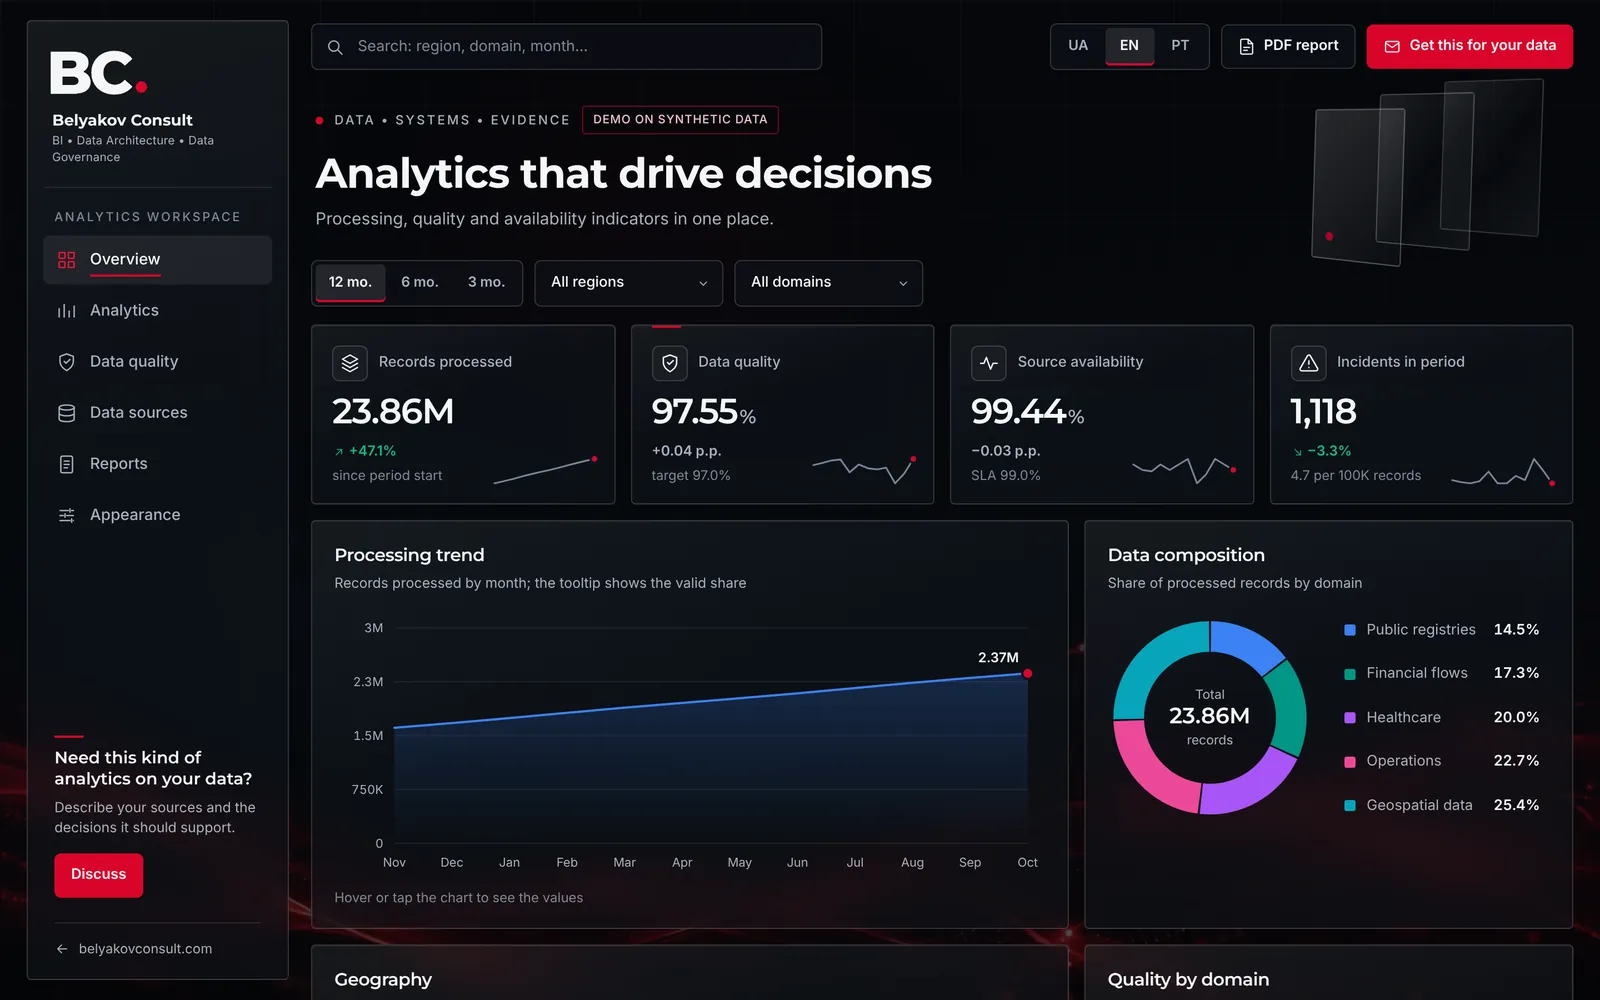
This is the kind of working tool I build for data teams: processing, quality and source availability indicators, a region × domain matrix and the exceptions worth reviewing first. The data is synthetic; the indicator logic is real.
Six pages: overview, analytics, data quality, sources, reports and appearance. The quality target moves with a slider, filters drive every chart, and a management PDF report is built from the current filters in one click. You can upload your own CSV: everything is calculated in the browser and the file goes nowhere.
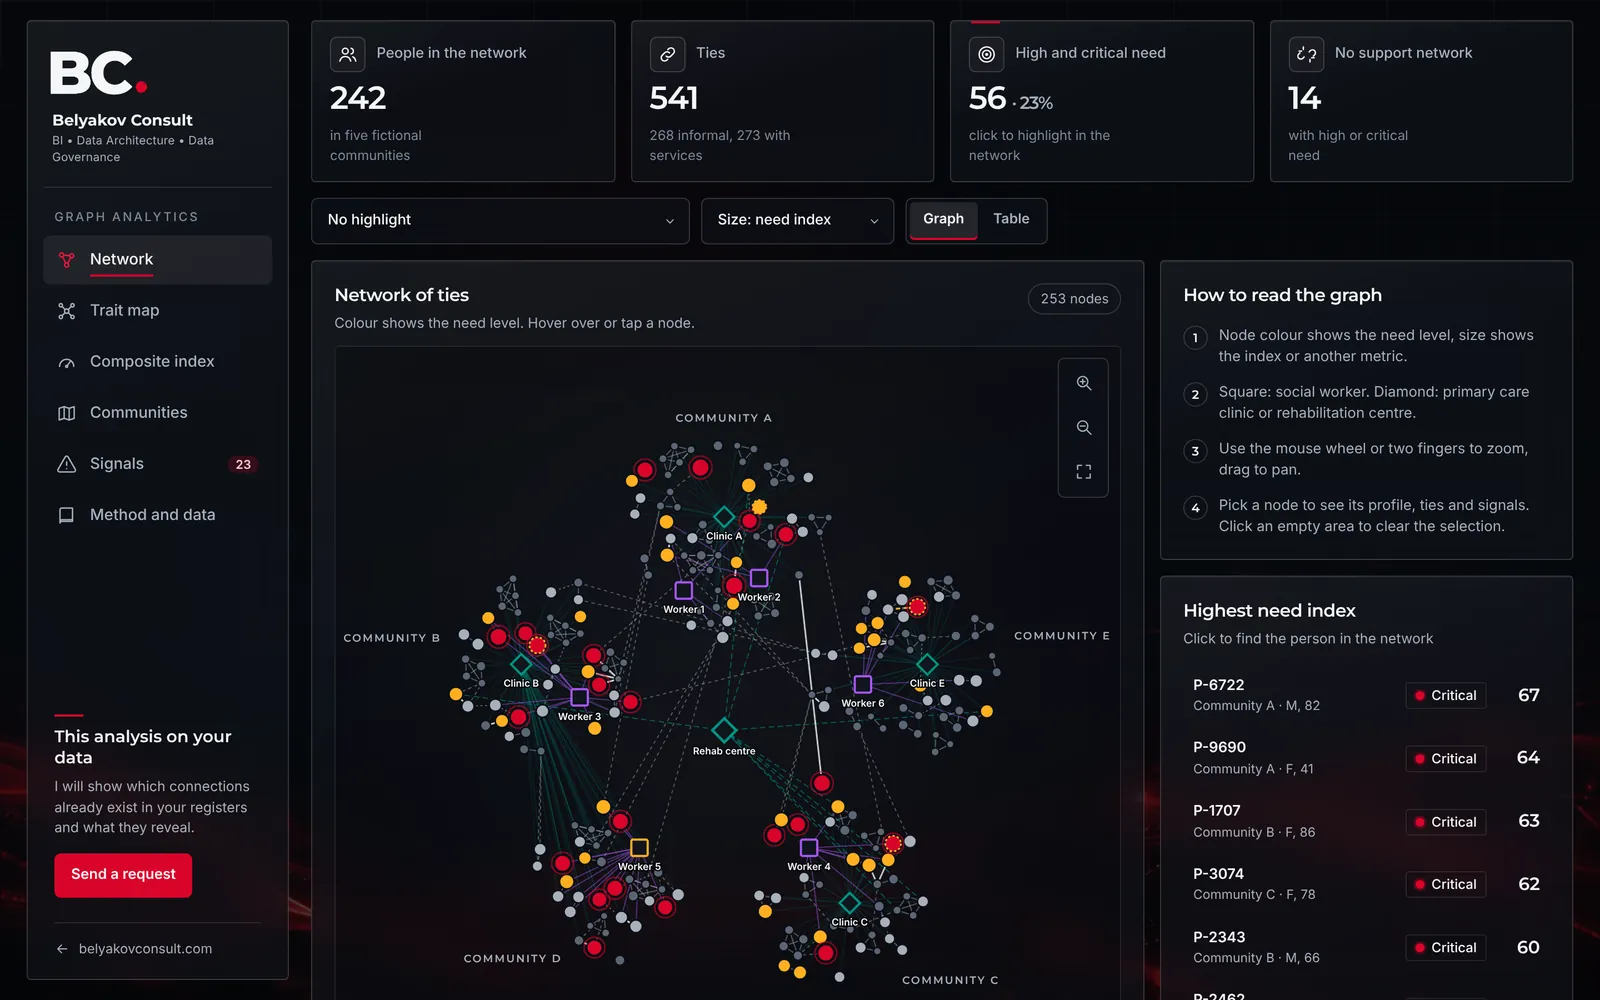
The graph shows what separate tables hide: who lives without a support network, who holds care together in a community, where social workers are overloaded and which records may be duplicates. The data is synthetic; the indicator logic is real.
Six pages: a network of people, households, social workers and clinics; a map of co-occurring demographic, social and medical characteristics; a composite index with weights you can change; a comparison of communities; signals for social work; the method and the rules for protecting sensitive data. Nodes and ties can be exported to CSV for Gephi or Neo4j.
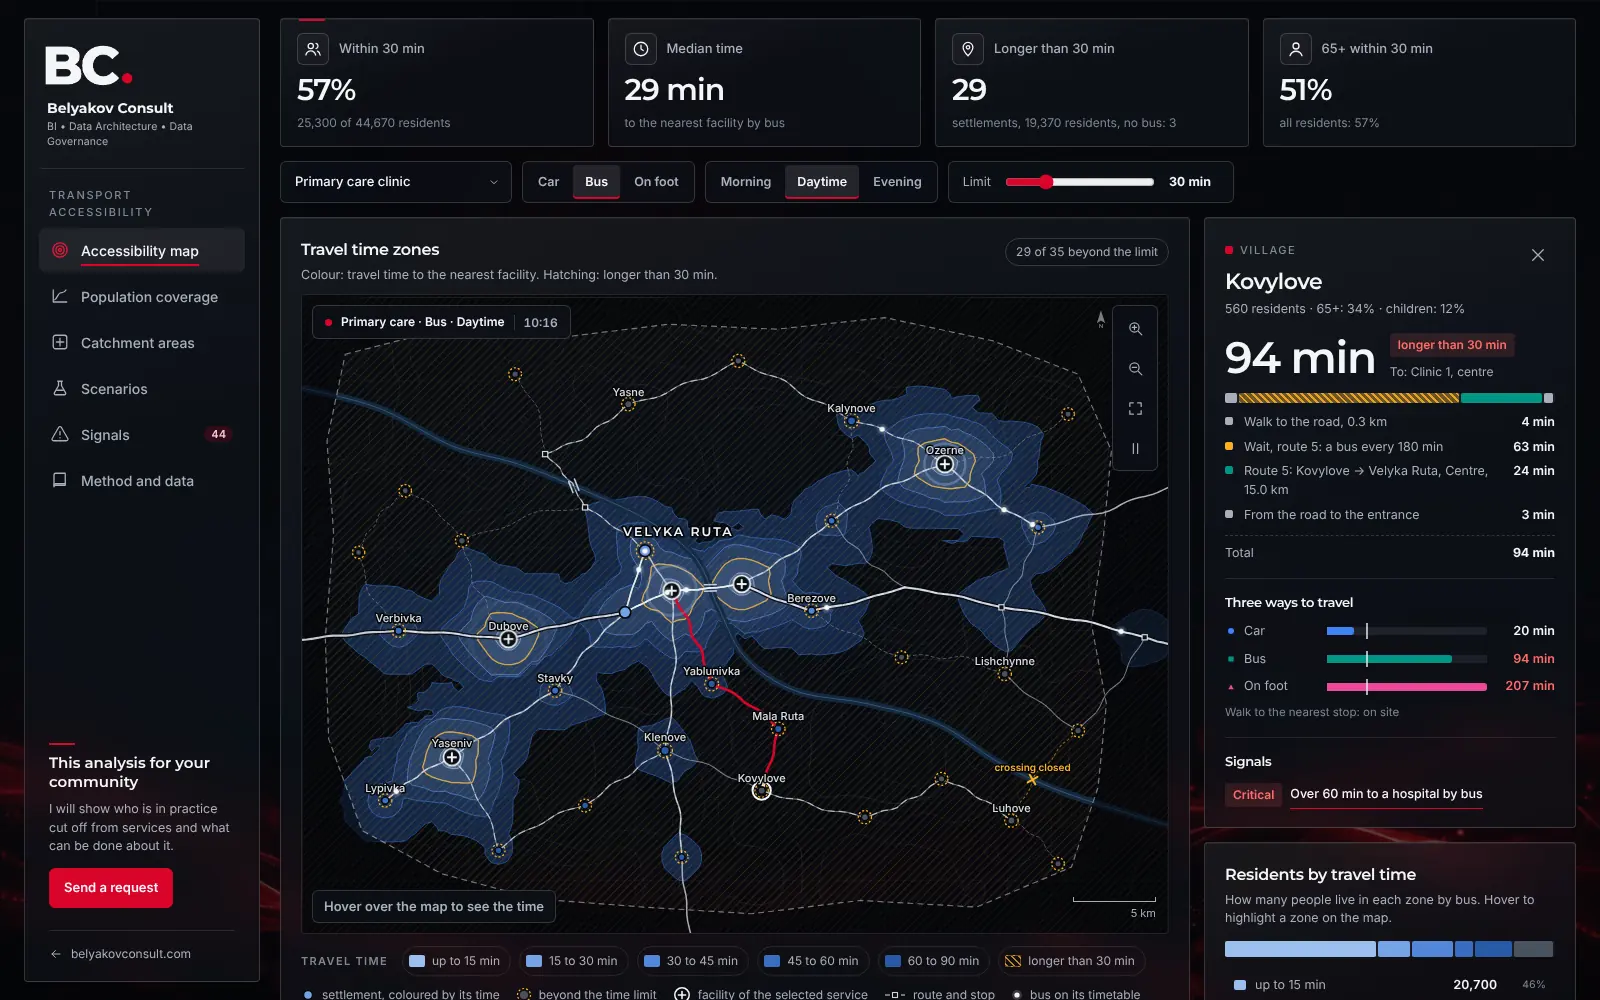
The map shows how long it really takes people to reach a clinic, a hospital or a public service centre: by car, by bus on its timetable or on foot. You can see villages that look close on a map but are in practice cut off from services, and places where a new point or an extra bus would make the biggest difference. The data is synthetic; the calculation logic is real.
Six pages: an isochrone map with buses moving on their timetable and the trip to the facility; population coverage curves with people aged 65+ and children shown separately; catchment areas and facility workload; scenarios with a reopened crossing, a demand responsive bus, more frequent services and a search for the best site for a new point; signals; the method. Travel time is calculated right in the browser and the results can be exported to CSV.
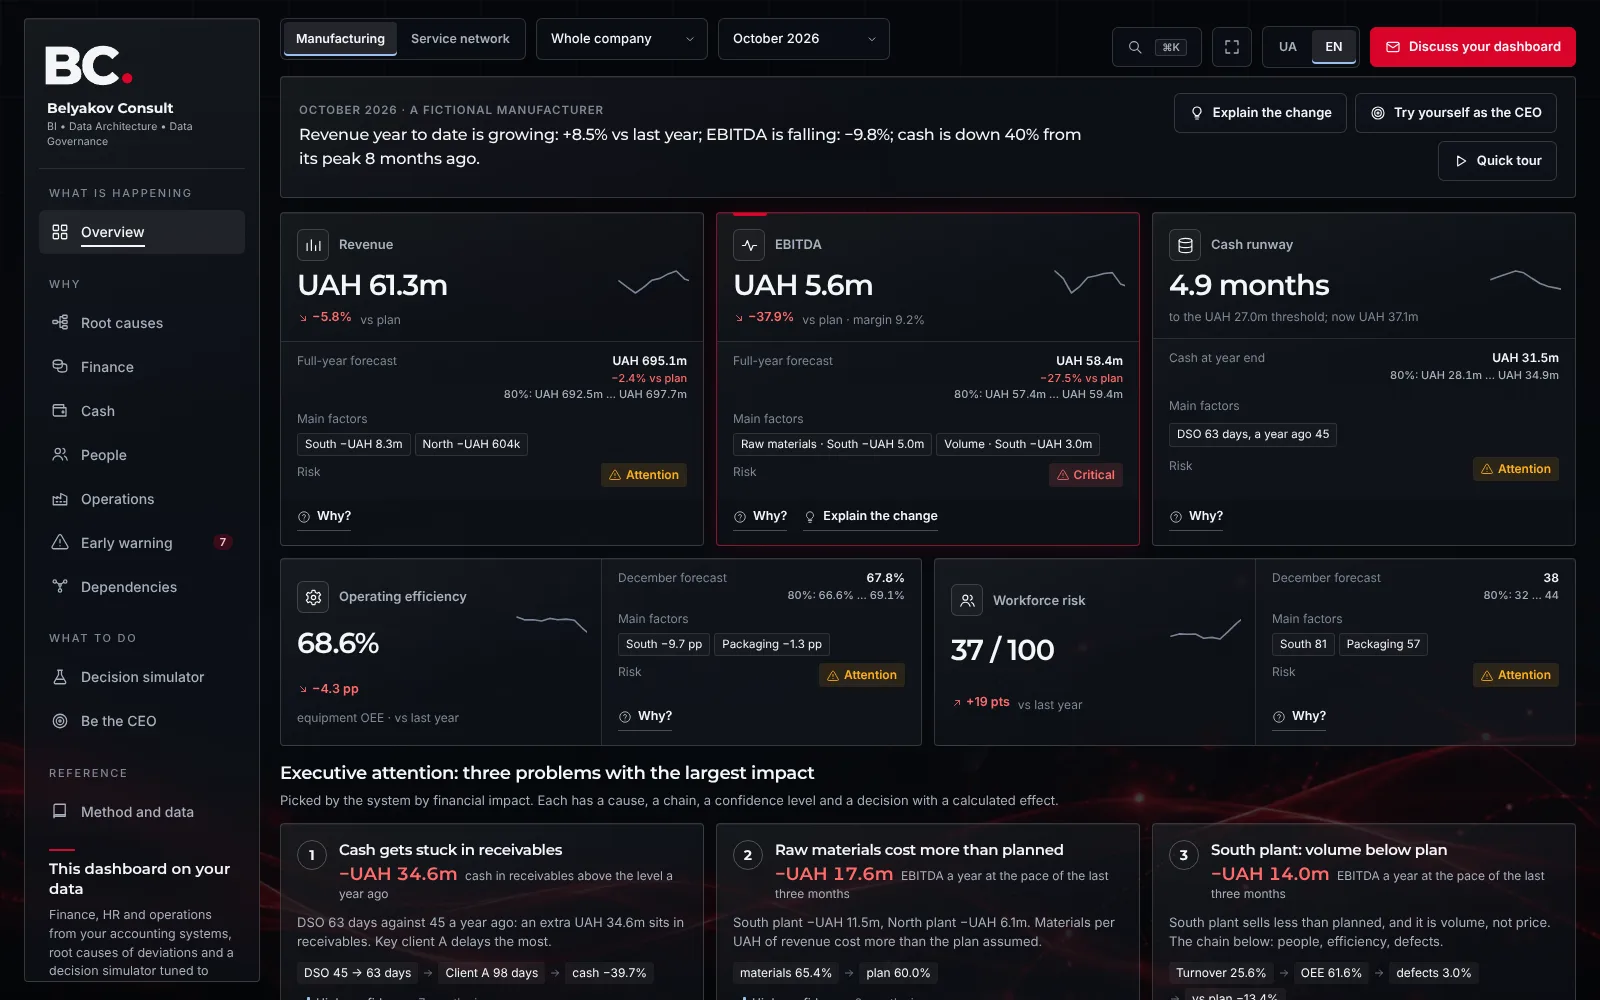
The dashboard is built around three questions. What is happening: five headline measures with a year-end forecast, risk level and causes, and the system picks the three problems with the largest financial impact. Why: a root cause tree breaks the EBITDA gap down to unit, product, line item and factor, and “Explain the change” builds an explanation from calculated factors without invented causes. What to do: a decision simulator shows EBITDA, cash against the threshold and workforce risk, with lags and demand elasticity. The data is synthetic; the logic of the measures is real.
Cash flow from clients to spending and a cash gap forecast with payment terms, early warning with unusual changes, confidence levels and forecast breaches, a risk heatmap, staff and client retention cohorts, a dependency graph that separates causes from correlations, and an effect × risk decision matrix with saved scenarios. Plus the “Be the CEO” challenge: three problems, three minutes and your decisions compared with the base case. Two fictional companies, search across the dashboard, full screen and state in the link.
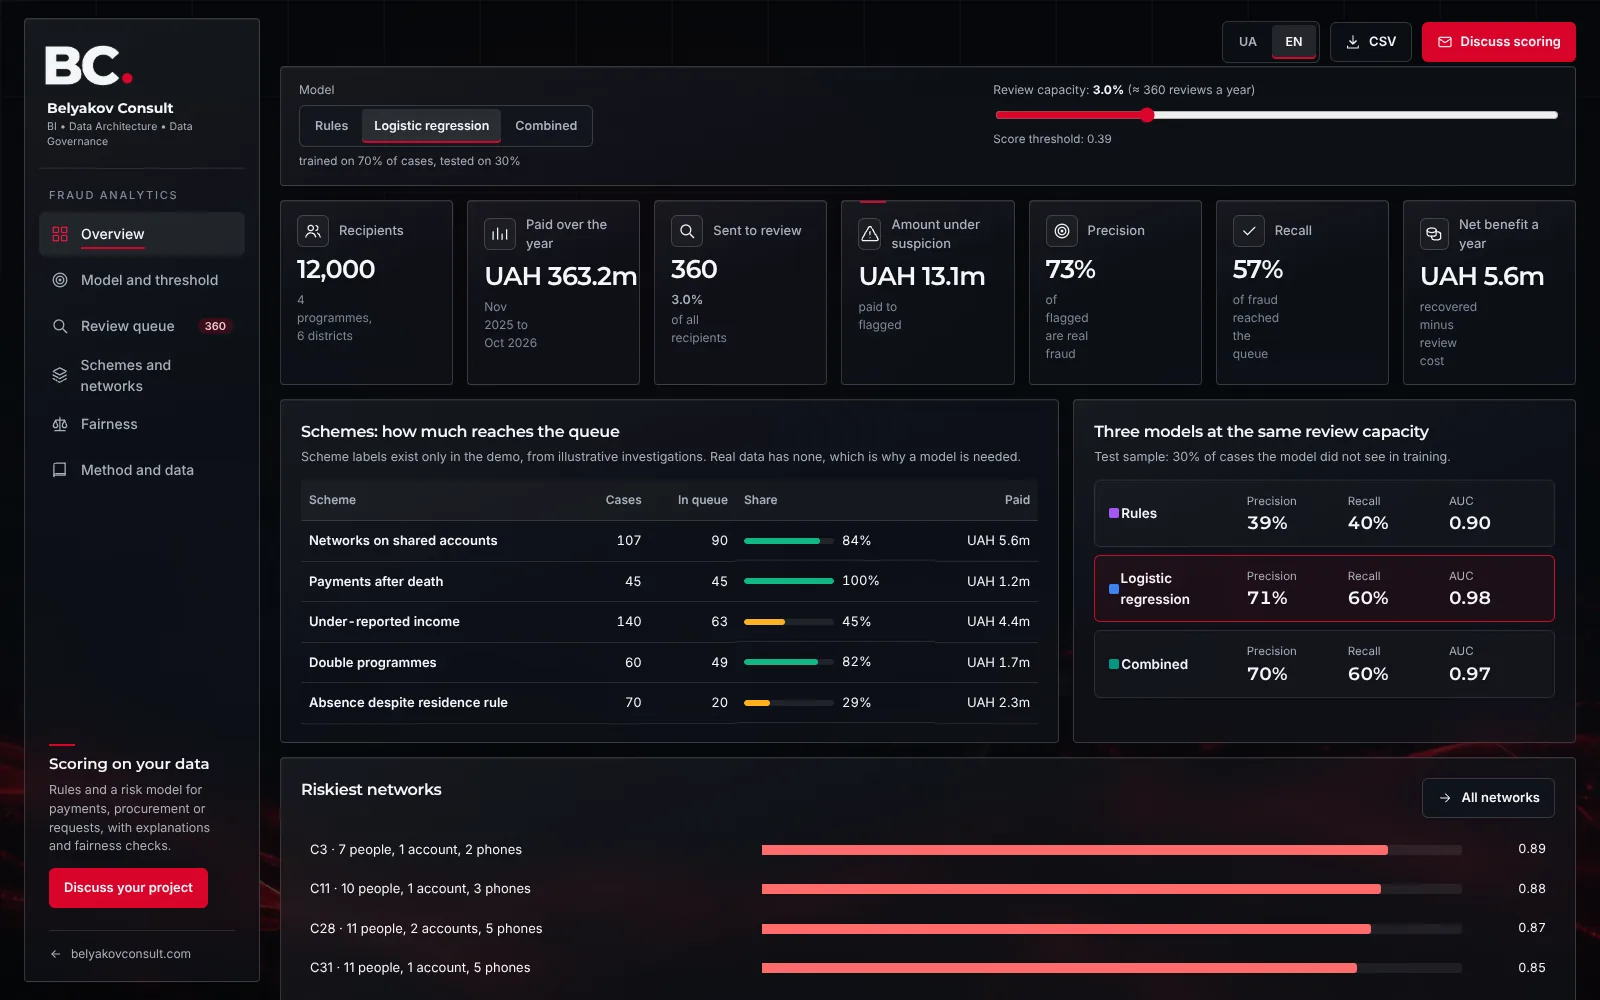
12,000 fictional recipients of four assistance programmes and five built-in schemes: networks on shared accounts, payments after death, under-reported income, double programmes, absence despite a residence rule. You can see how transparent rules, logistic regression and a mix of both build a review queue and what it is worth in money. The data is synthetic; the method is real.
Six pages: overview, model and threshold (confusion matrix, ROC curves, benefit by review capacity, coefficients), a review queue explaining each score, networks on shared accounts with a link graph and operators, model fairness by group, method. The model trains right in the browser, and scores can be exported to CSV.
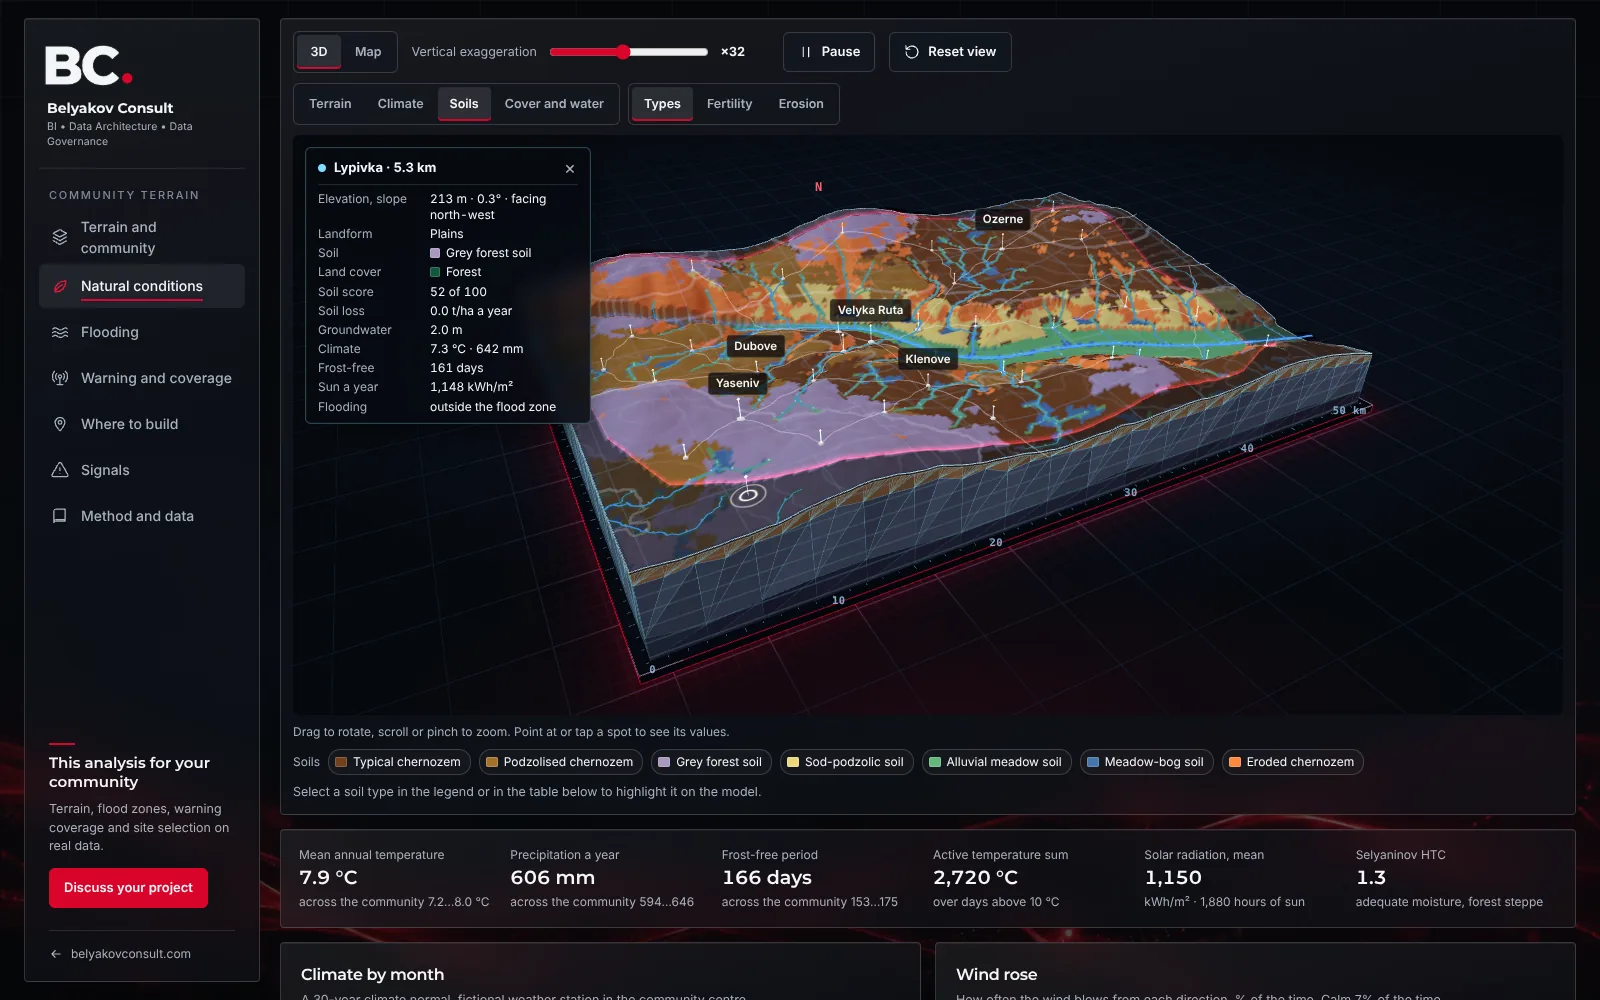
The same fictional community as in the transport accessibility demo, now on 3D terrain. Raise the river level and see which villages flood and who loses the road to a hospital. You can also see where sirens cannot be heard, where to put telecom towers and which sites suit a new shelter or clinic. Plus climate, soils, erosion and groundwater: point at any spot on the model to see its values. The data is synthetic; the method is real.
Seven pages: terrain and a profile between settlements; natural conditions with 13 layers on the model (slope, aspect, solar radiation, temperature, precipitation, frost, soils, fertility, erosion, land cover, groundwater), climate by month, a wind rose and flood recurrence; flooding with an animated water rise; warning and coverage; site suitability; signals; method. The model can be rotated and zoomed with adjustable vertical exaggeration, and there is a top-down map mode.
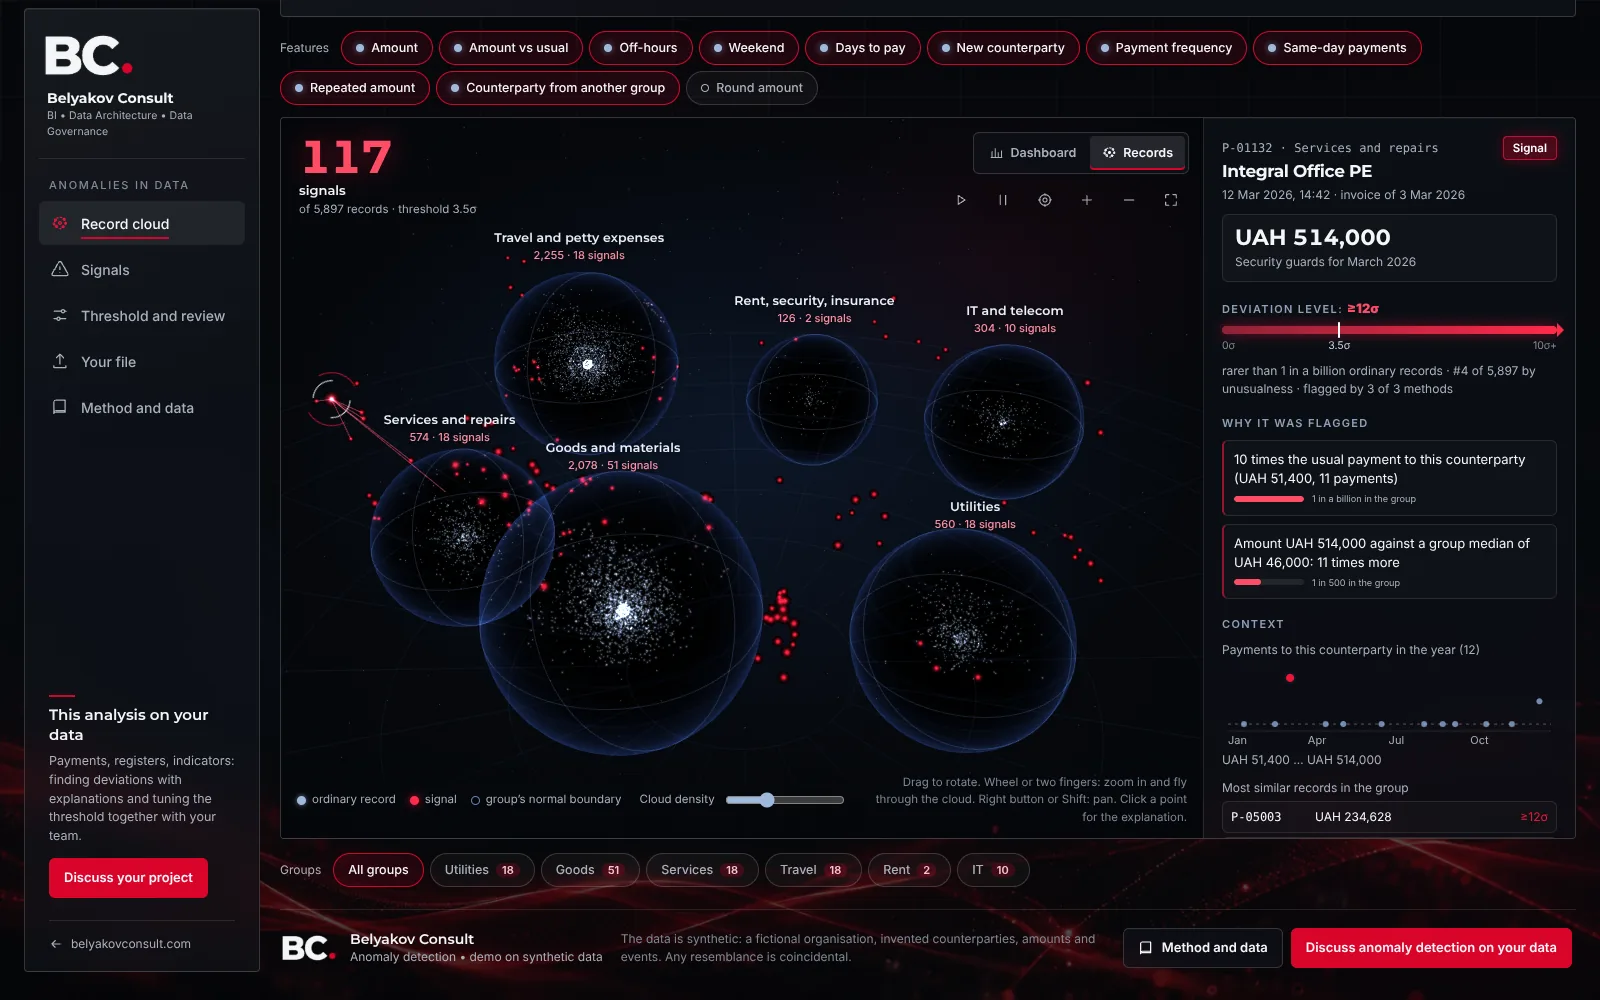
Almost 6,000 payments made by a fictional organisation in a year. The monthly report is green and the deviation from plan is under one percent. Now the same data as a cloud of records: each point is a payment, unusual ones glow ruby. Rotate the cloud, zoom in and fly through it. Click a point to see why the record was flagged, how strong the deviation is and why it may be normal rather than an error or fraud. The data is synthetic; the method is real.
Five pages: the record cloud, which unfolds from a regular dashboard; a list of signals with reasons; threshold and review (how many errors and risks are found, how many rare but normal cases, a comparison of three methods: feature deviation, isolation forest, nearest neighbours; a group’s own baseline or a shared one); anomaly search in your own CSV or Excel file right in the browser with a download of suspicious records; the method.
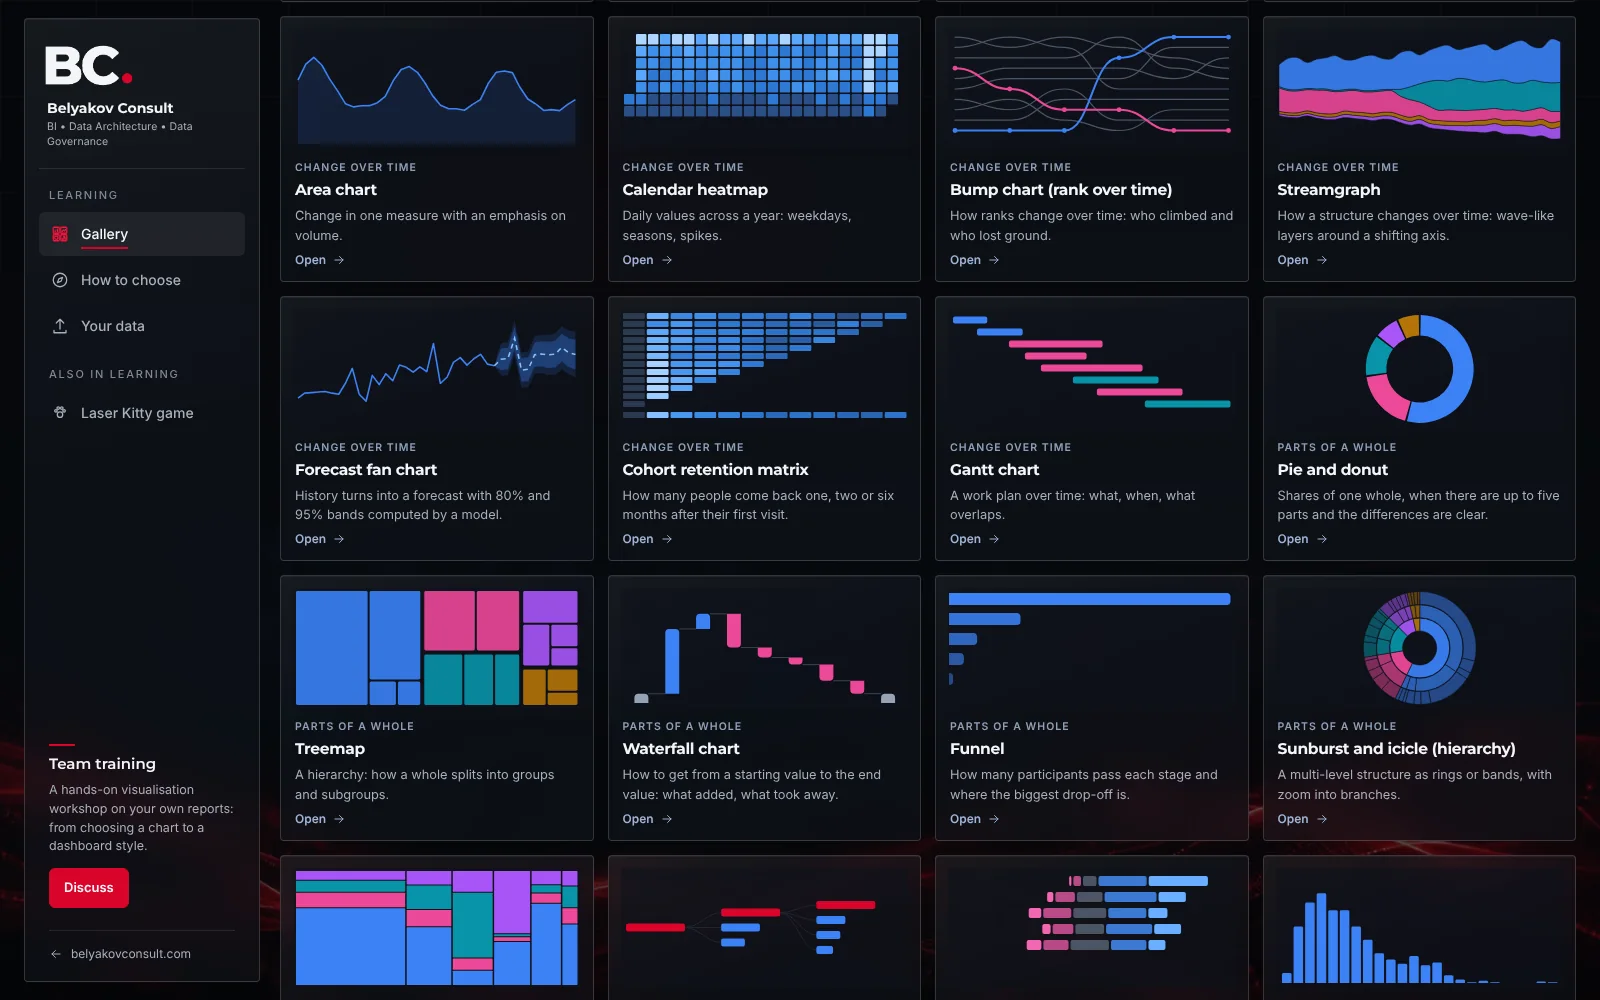
A gallery of visualisations for reports and dashboards: from columns, lines and parts of a whole to distributions, relationships and flows. Plus analytical formats: a bump chart, violin and ridgeline plots, parallel coordinates, a chord diagram, a forecast fan chart, a process control chart, cohorts, a decomposition tree, a sunburst, a bivariate map of Ukraine and a travel time map. For each type: when it fits and when another one is better, tips and common mistakes. Live examples on illustrative community and budget data.
An Excel sample for every type with an explanation of each column; a chart built from your own CSV or Excel right in the browser with automatic column matching; small multiples for lines, columns and scatter plots; map zoom and drill-down into hierarchy branches; a “Your data” page that shows which charts your table can make; guidance on choosing a form for the task and the mistakes that distort data; PNG and SVG export.
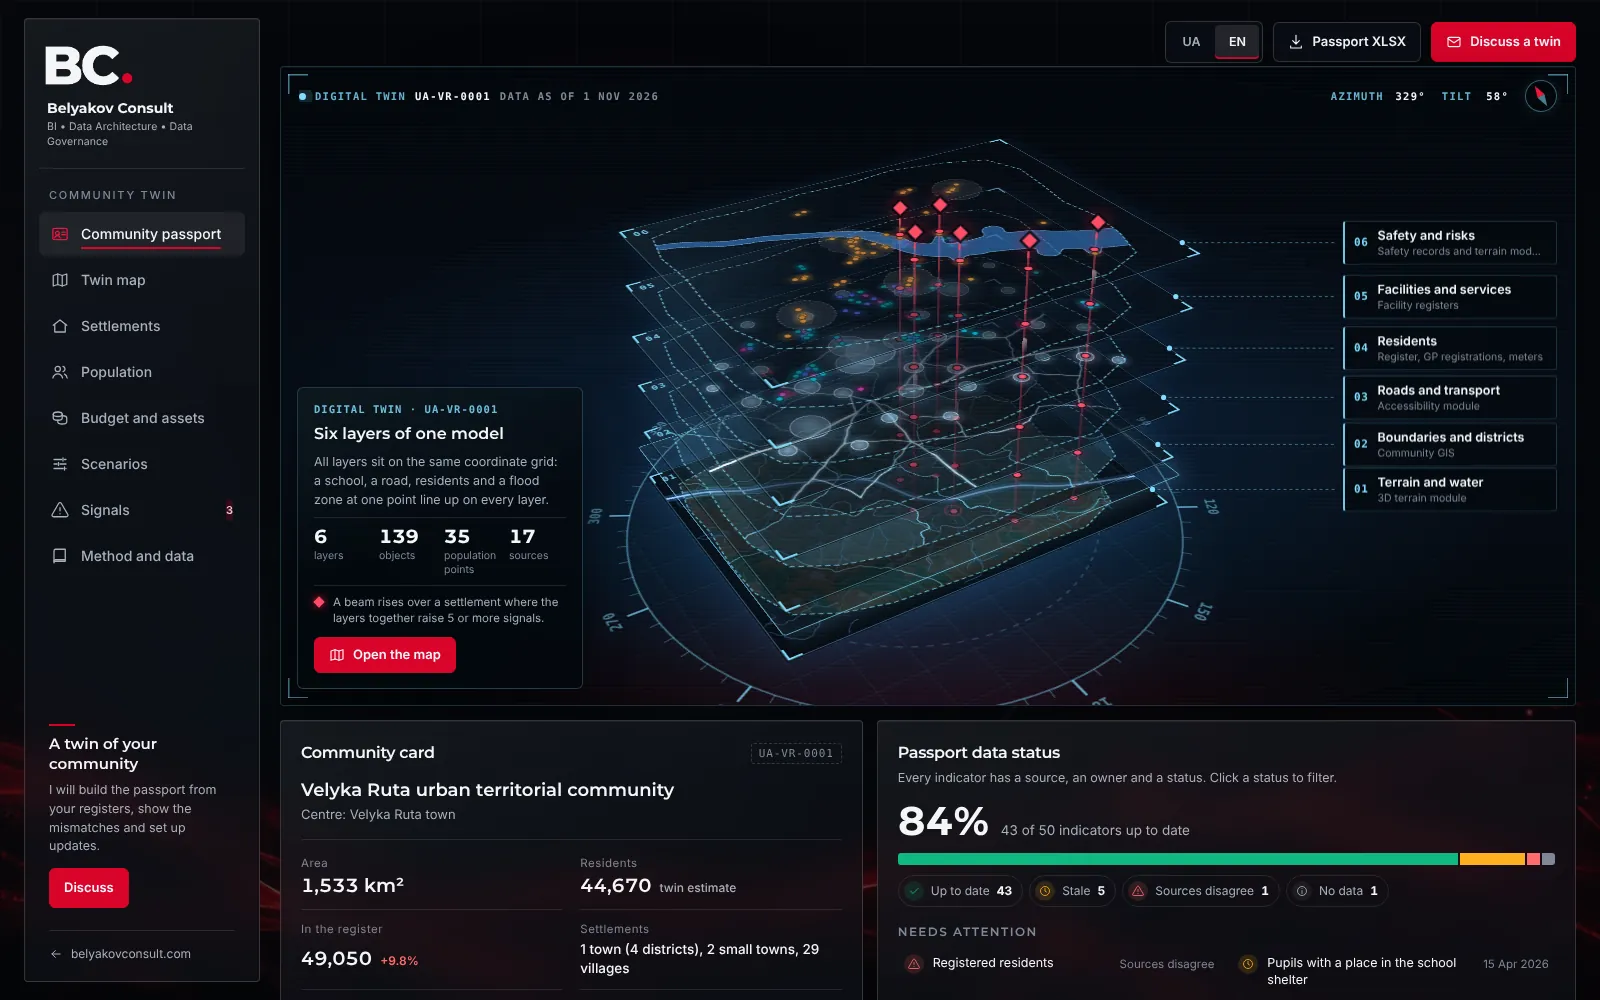
The fictional community of Velyka Ruta in one model: 32 settlements, 139 register objects, roads, terrain and risks. A community passport of 50 indicators where every number has a source, an owner, a date and a status: up to date, stale, sources disagree, no data. You see not only the value but whether you can trust it.
Twin layers in 3D that you can rotate and take apart right on the page, and a map of every register with a card for each object; a passport for every settlement; the resident count reconciled from the register, GP registrations and meters, with a projection to 2035; the budget per actual resident, farmland cultivated without documents and buildings without ownership records; school network, long blackout and flood scenarios with their effect on the passport; 14 signals, an indicator catalogue, Excel exports and a check of your own passport file.
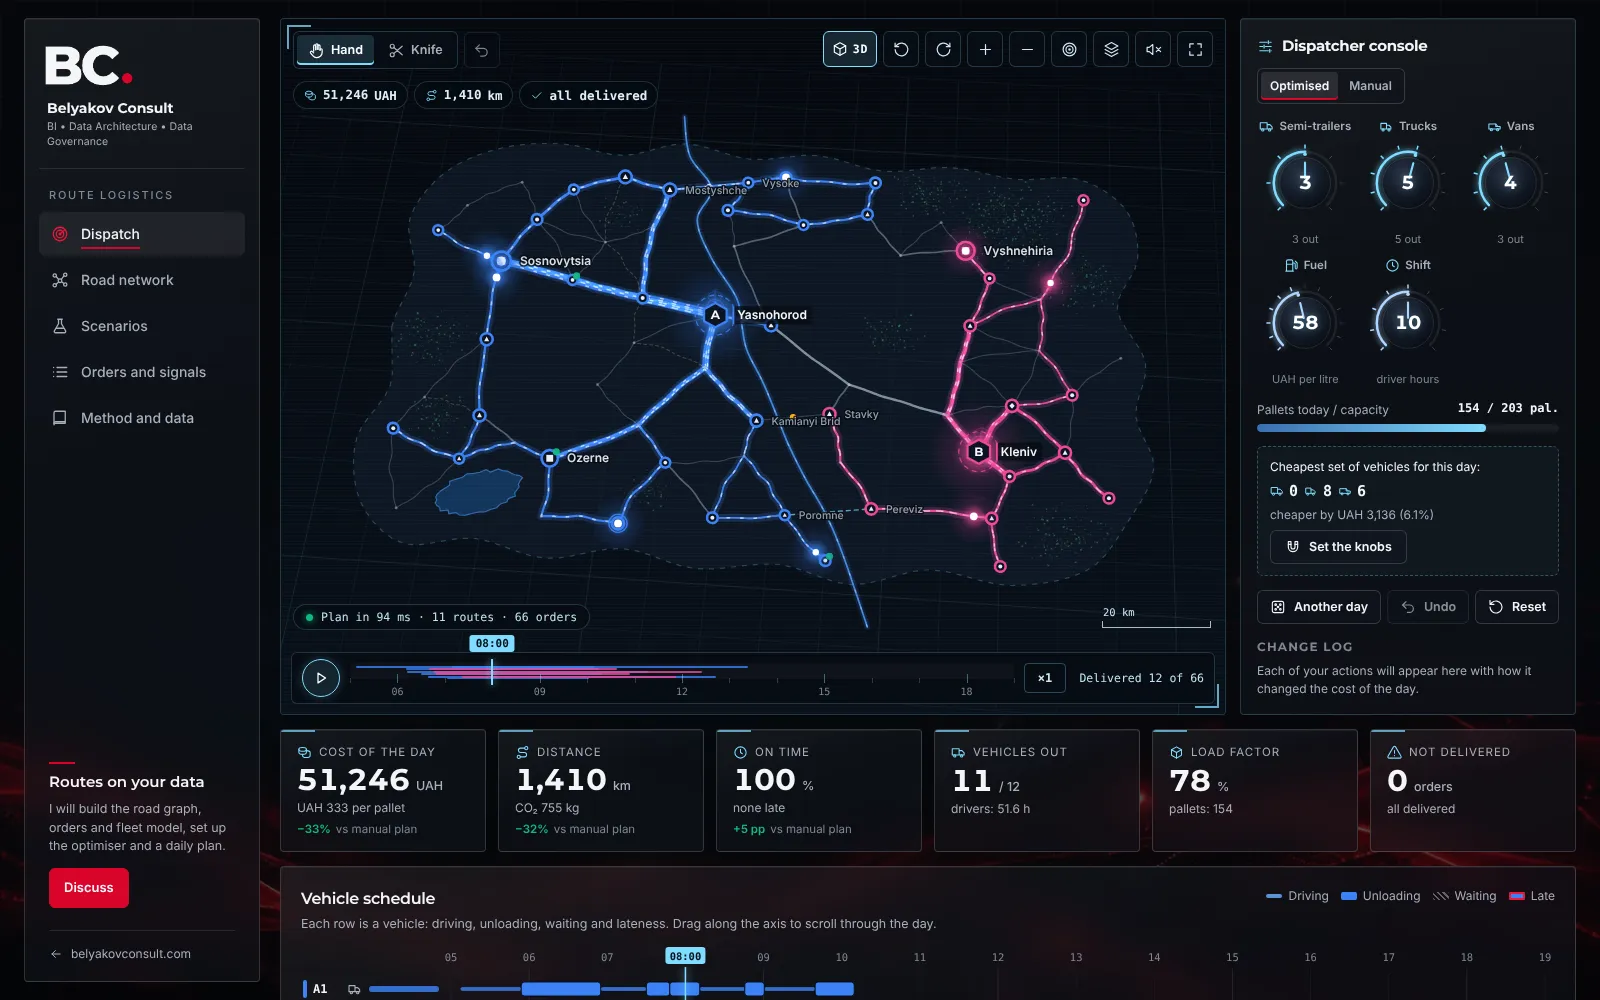
A regional distributor: two depots on opposite banks of a river, 12 vehicles and 66 orders a day to supermarkets, shops, hospitals, schools and Invincibility points, each with its own delivery window. The optimiser builds routes in tens of milliseconds and shows what they cost, how many kilometres they take and who will arrive late.
A 3D map you can tilt and rotate: drag a depot and the routes rebuild as it snaps to settlements; slice a road with the knife; press and turn a settlement to change its order; knobs for the fleet, fuel and shift; a vehicle schedule you can scrub through the day. The road graph with pallet flow, centrality, critical links, dead ends and weight limits, and a slider that turns the map from kilometres into minutes. Scenarios for a bridge under repair, a flood, black ice and a demand peak, a search for the best third depot, signals, a comparison with the manual plan and Excel exports.
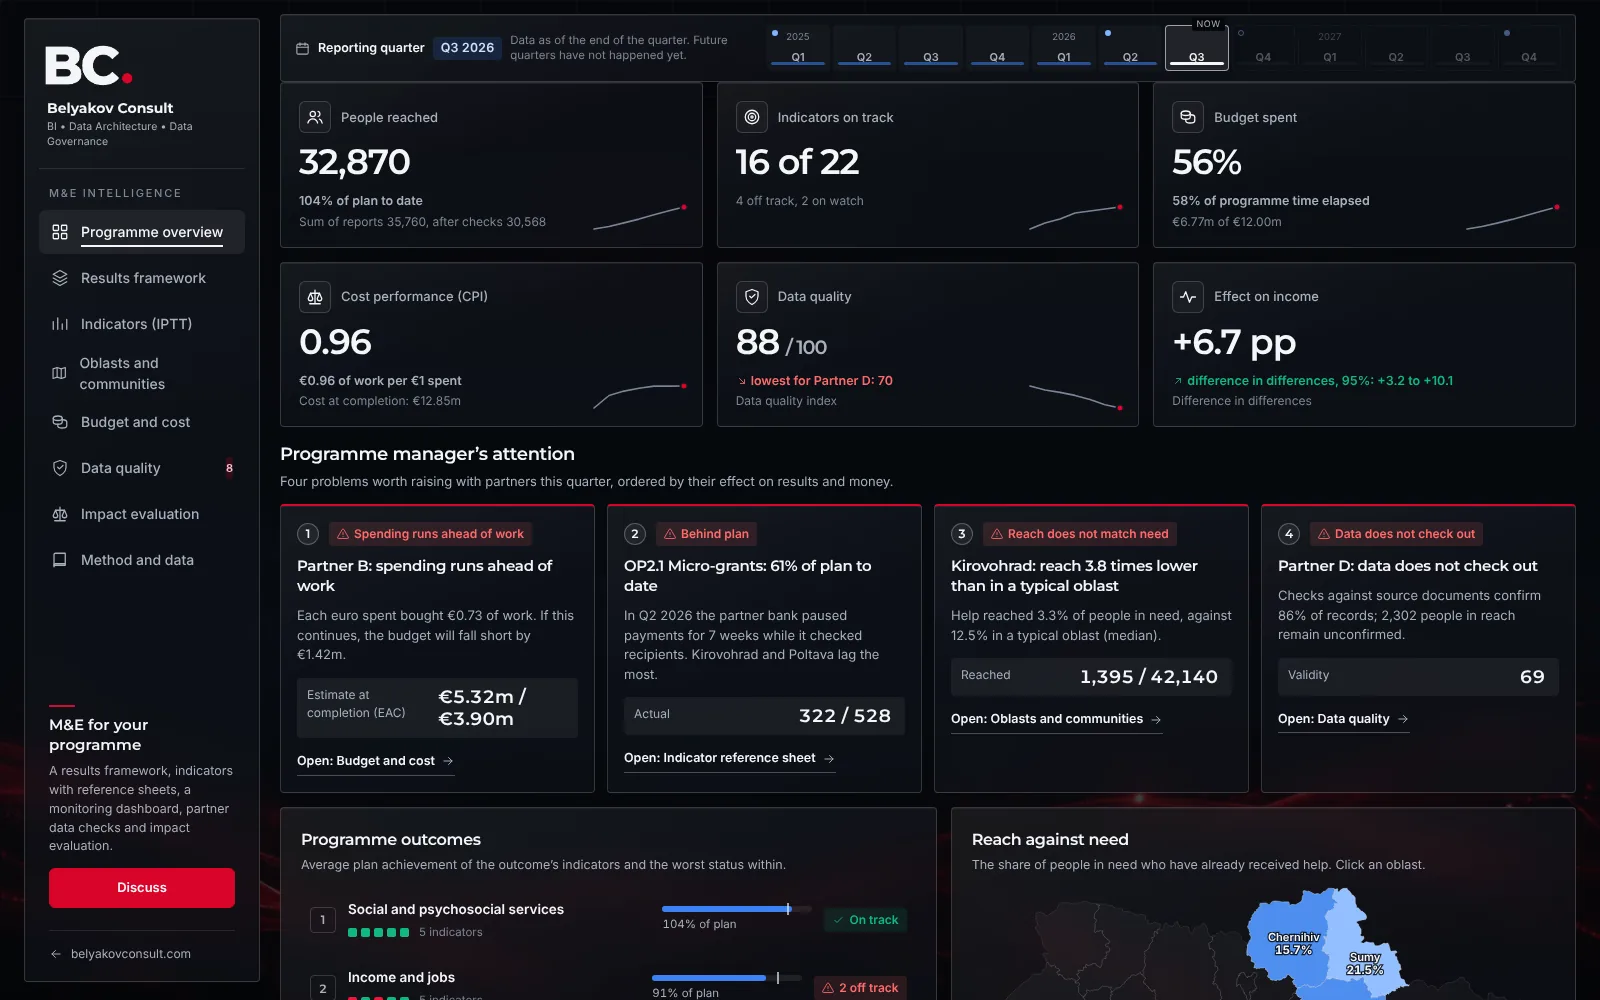
A fictional donor programme restoring services in six oblasts: five partners, 36 communities, €12m and 22 results framework indicators. One system instead of a dozen spreadsheets: plan and actual for any quarter, reach without double counting, money against work done and checks of partner data. Move the reporting quarter back and see when each problem first became visible.
An overview with the programme manager’s attention: a repair cost overrun, a micro-grant pause, a blind spot in Kirovohrad Oblast and data that does not check out. A results framework with assumptions and the flow of money from outcomes to oblasts. An indicator table (IPTT) with a reference sheet for every indicator, a forecast to the end of the programme, the chance of reaching the target and the gap by oblast. Earned value (EV, CPI, SPI, estimate at completion) and cost per result. Data quality on the five DQA standards: checks against documents, double counting, the last digit test, late reports. Impact evaluation on a panel of 3,000 households: before and after gives +13 pp, an after-only comparison gives −1, difference in differences +7, and you can see whom the programme did not help. OECD DAC criteria, recipients’ voice, a draft donor report, the indicator table and a reference sheet template in Excel, and a check of your own table right in the browser.
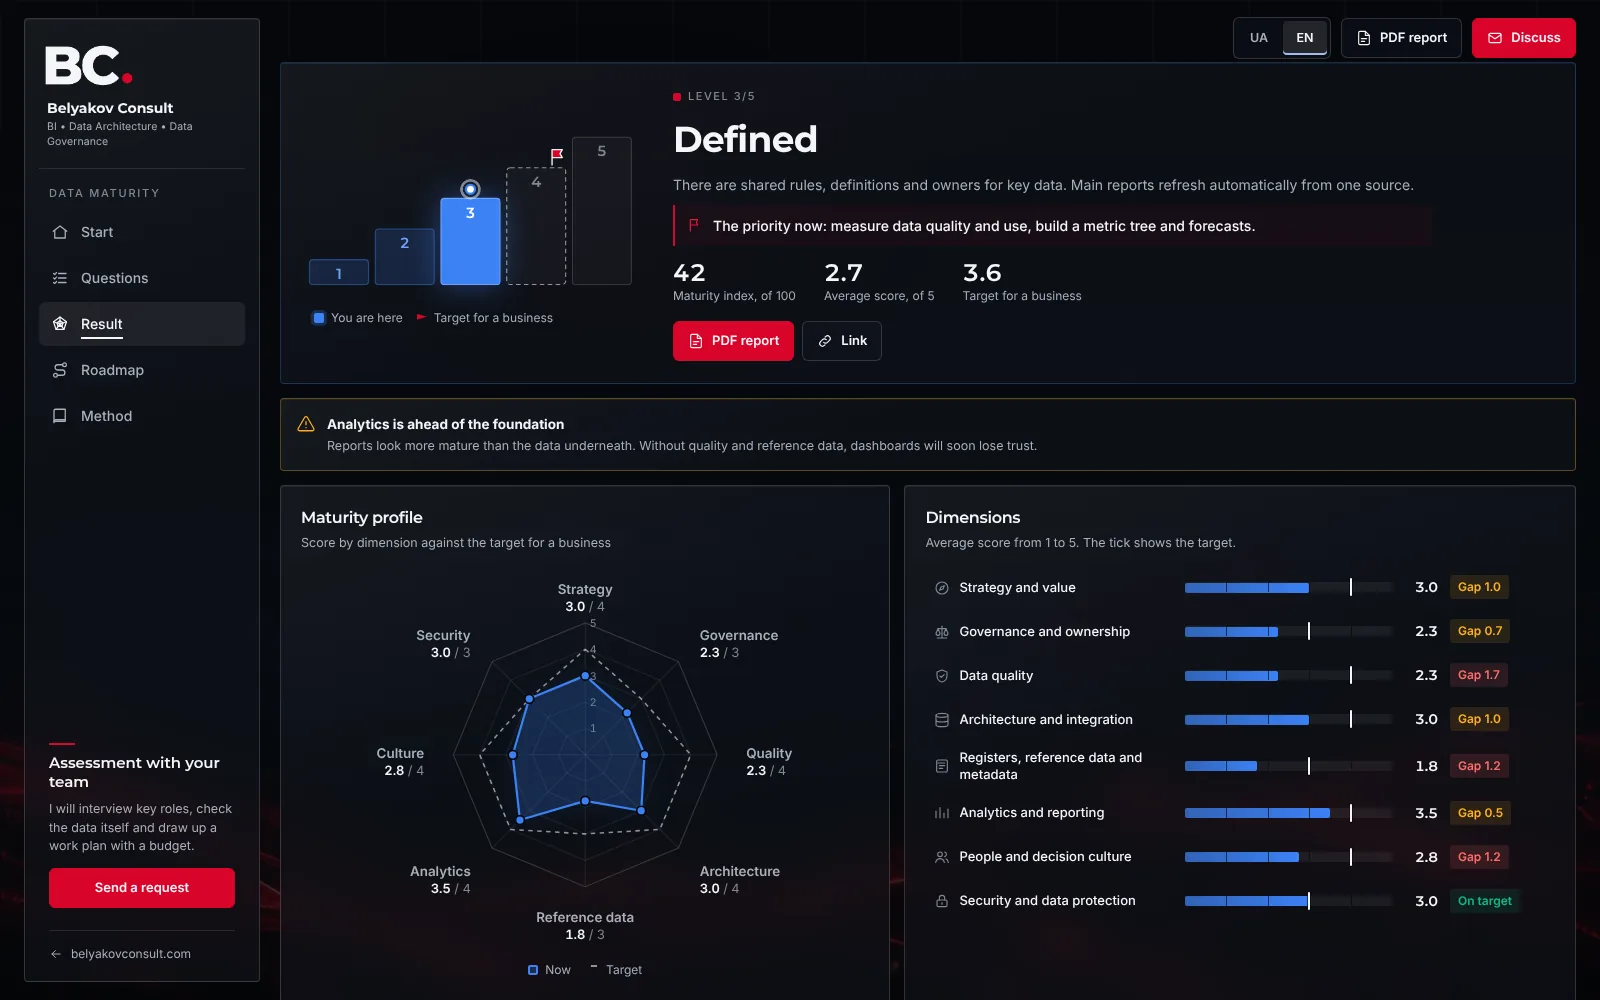
32 questions across eight dimensions: strategy, governance, quality, architecture, registers and reference data, analytics, people and security. Every answer describes a specific practice rather than an abstract “good or bad”, so the assessment takes about 10 minutes and needs no preparation. Your answers stay in your browser and nothing is sent.
A level from initial to optimised, a maturity index and a profile by dimension against the target for your type of organisation: a community, a public body, a business, an NGO or a donor programme. Three priorities that account for the foundation (governance, quality, reference data, architecture) weighing more, because everything else rests on it. Caveats such as “analytics is ahead of the foundation” or “analytics rests on one person”, strengths and “what not to do now”: do not buy a new BI platform while metrics are counted differently, and do not automate dirty data. A 30, 90 and 180 day roadmap with ticks for what is done, a PDF report for your team or leadership, a link to the result and three examples: a community, a company and a donor programme.
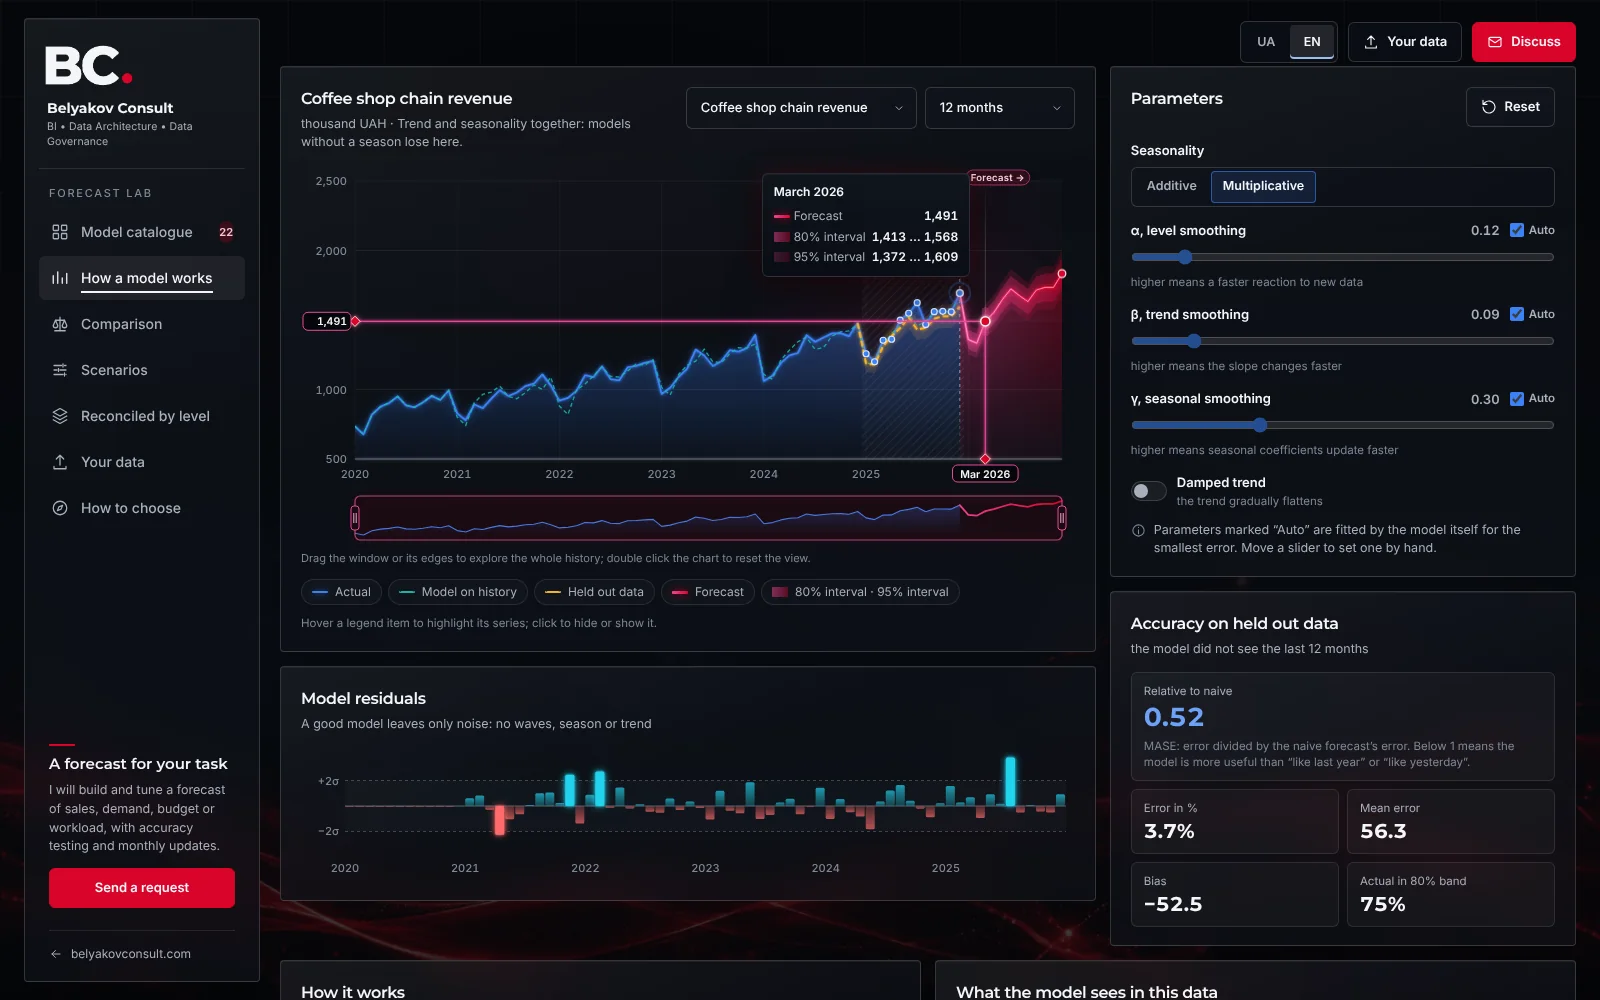
22 models from the naive forecast to boosting in one section: benchmarks, exponential smoothing, Holt-Winters and TBATS for several seasonal cycles, regression with drivers and Prophet with holidays and trend breaks, ARIMA and SARIMAX, growth curves, decomposition, Croston’s method with the SBA and TSB variants, Monte Carlo, analog search, gradient boosting explained with SHAP and an ensemble. Each model is shown on data where it is easiest to see: steps with formulas, parameters you can move and what the model sees in the series: trend, seasonal cycles, holidays, driver contributions or paths.
A fair comparison of every model on one series with repeated tests over four time windows; a scenario forecast with “base”, “optimistic” and “stress” switches and sliders for price, budget and market; a forecast reconciled across levels “region → communities → services” where the totals add up; 12 datasets to download as CSV or Excel; Excel workbooks where the model is calculated with formulas and updates when you change a parameter; Python and R code. On the “Your data” page you can upload your own file: every model is tested on it, the most accurate one builds a forecast with an interval, and the result downloads to Excel. The file never leaves the browser, the examples are synthetic.
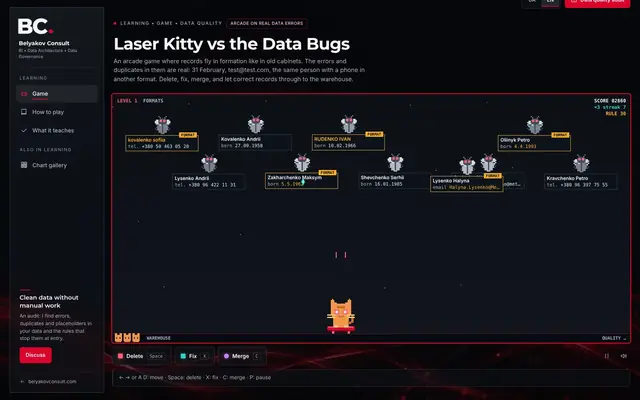
An arcade game about data quality: real errors, formats and duplicates, five levels and an explanation for every mistake.
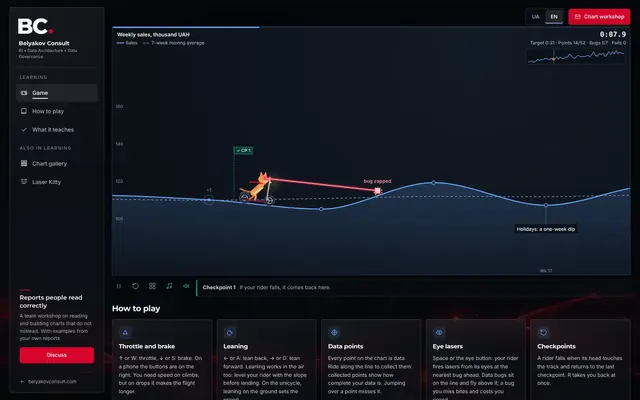
A Gravity Defied-style game: three riders with laser eyes ride charts. Twelve tracks from easy to hard, a debrief after each, a leaderboard and four Hell tracks with 90s game rules.
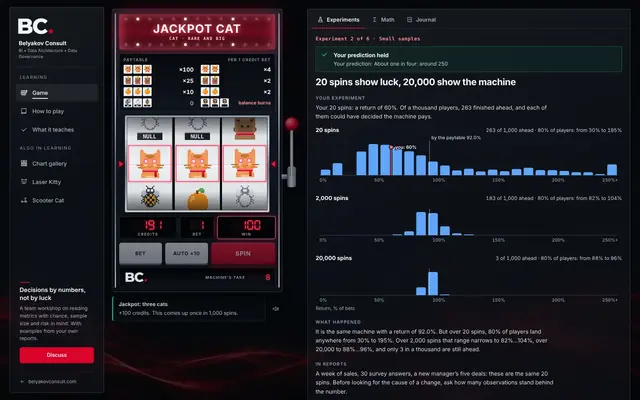
An 80s slot machine that shows its math: cats and capybaras pay, bugs spoil the line, three Data Bosses wipe the balance. Six experiments on probability and risk, each with a prediction and a debrief.
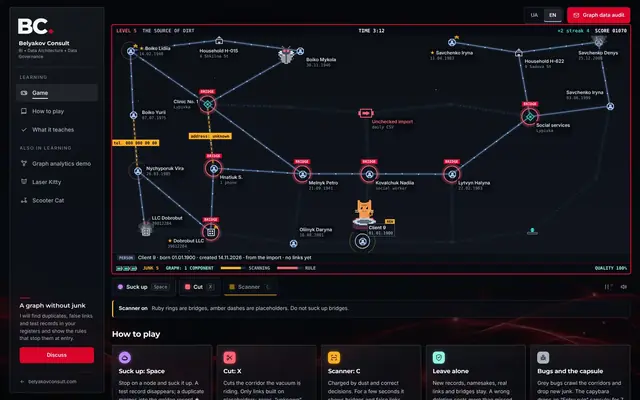
Pac-Man on a relationship graph: remove orphans, merge duplicates, cut false links and do not swallow a bridge node, or the graph falls apart.
Nothing found. Try another word or reset the filter.
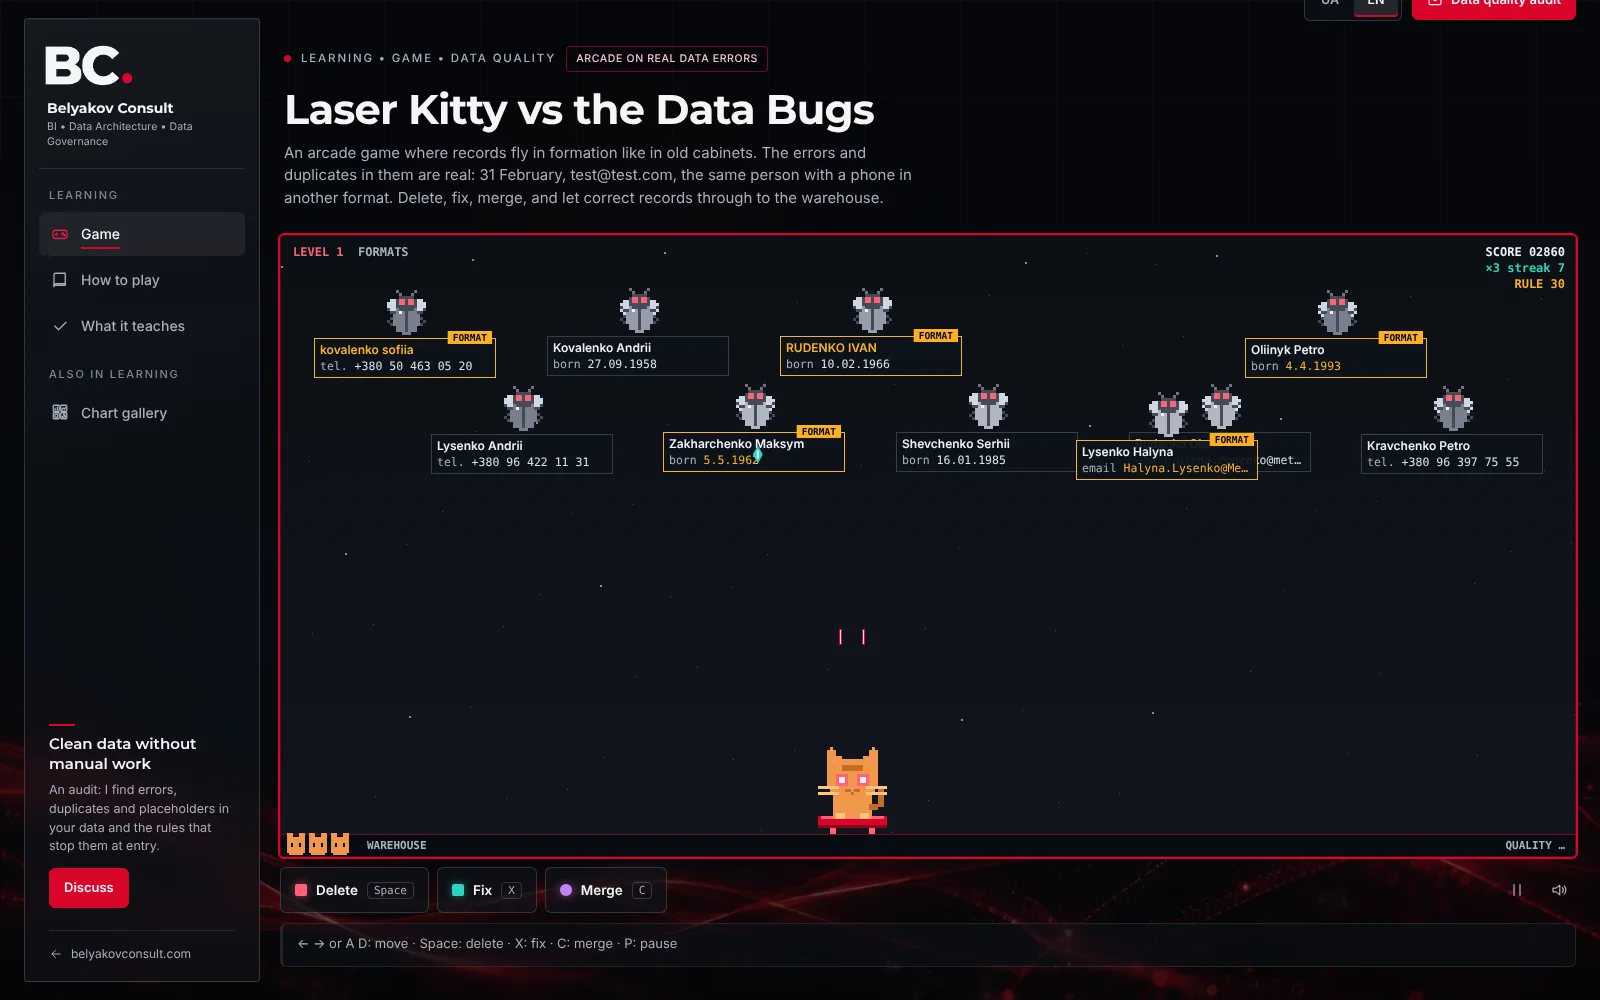
An arcade game in the spirit of old cabinets: record bugs fly in formation and dive at the warehouse, and a kitten with laser eyes deals with them. The errors are real: 31 February, month 13, test@test.com, 01.01.1900, a phone in five formats, the same person with an initial instead of a first name. The laser deletes impossible values and placeholders, the fix beam normalises formats, the merge beam fuses duplicates, and correct records must be let through.
Five levels: formats, impossible values, duplicates and namesakes, placeholders, and a source that keeps sending errors until you seal it with an entry rule. After each level: warehouse quality, skills and an explanation of every mistake with a tip for doing the same in Excel or Power Query; level records download as CSV. A calm mode without return fire, keyboard and touch controls.
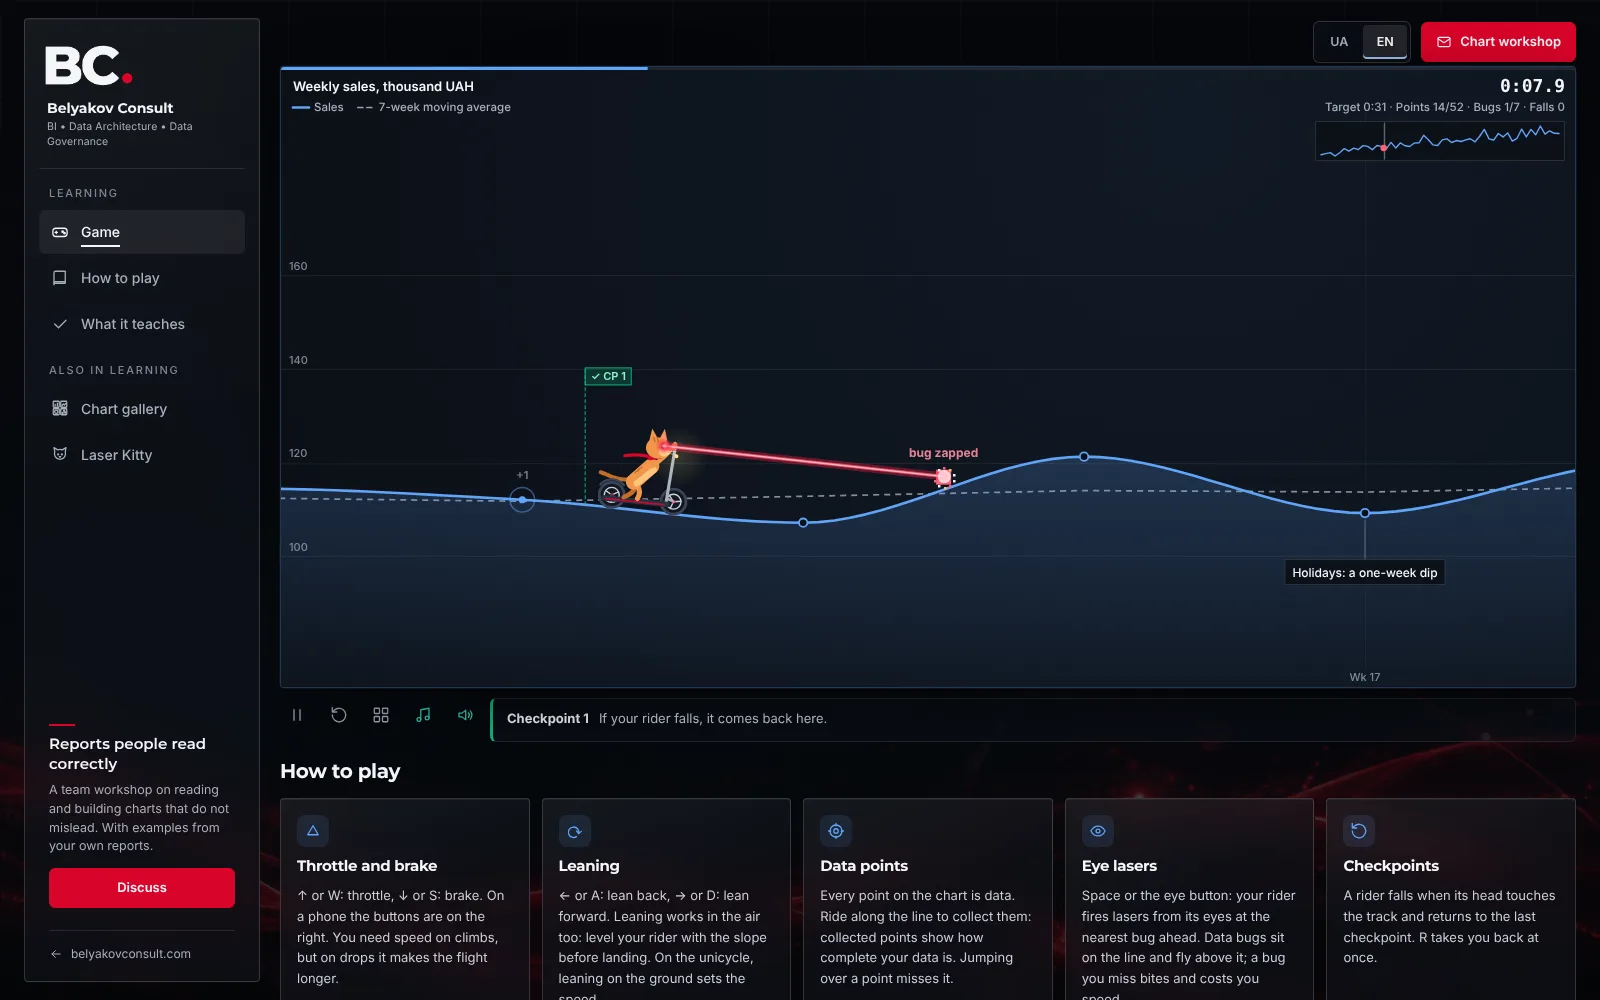
A game in the style of Gravity Defied: guide a rider on wheels along a track that is really a data chart. Throttle, brake and lean, climbs, drops and jumps, landings on both wheels, and eye lasers that clear data bugs sitting on the line and flying above it. There are three riders, each with its own physics: a cat on a scooter, a capybara on a skateboard and the Head of Analytics on an electric unicycle. All to an 8-bit tune.
Twelve tracks from easy to hard, each a different kind of chart with a report trap: trend and noise, a histogram (the average receipt versus the median), seasonality, a Pareto chart (group A brings 80% of revenue), outliers, a truncated axis that drops to zero at a gate, a stacked area, a waterfall from revenue to profit, a log scale, a control chart with limits, small multiples on one scale with gaps between the panels and a forecast band where you only see the real road just ahead of your wheels. After each level a debrief with the numbers of that track and a tip on doing the same in Excel; data points, time, bugs, stars and best times. A calm mode, keyboard and touch controls. A leaderboard for each rider, each difficulty group and all 12 main levels: enter a nickname after finishing and share a link to the leaderboard page. For those who want more, four Hell tracks with 90s game rules: candlesticks, a Gantt chart, a temperature corridor and a receivables saw. One life and no checkpoints, a bug kills at first touch, a hard landing wrecks your rider and the timer does not wait; Hell has its own leaderboard and its own hellish tune.
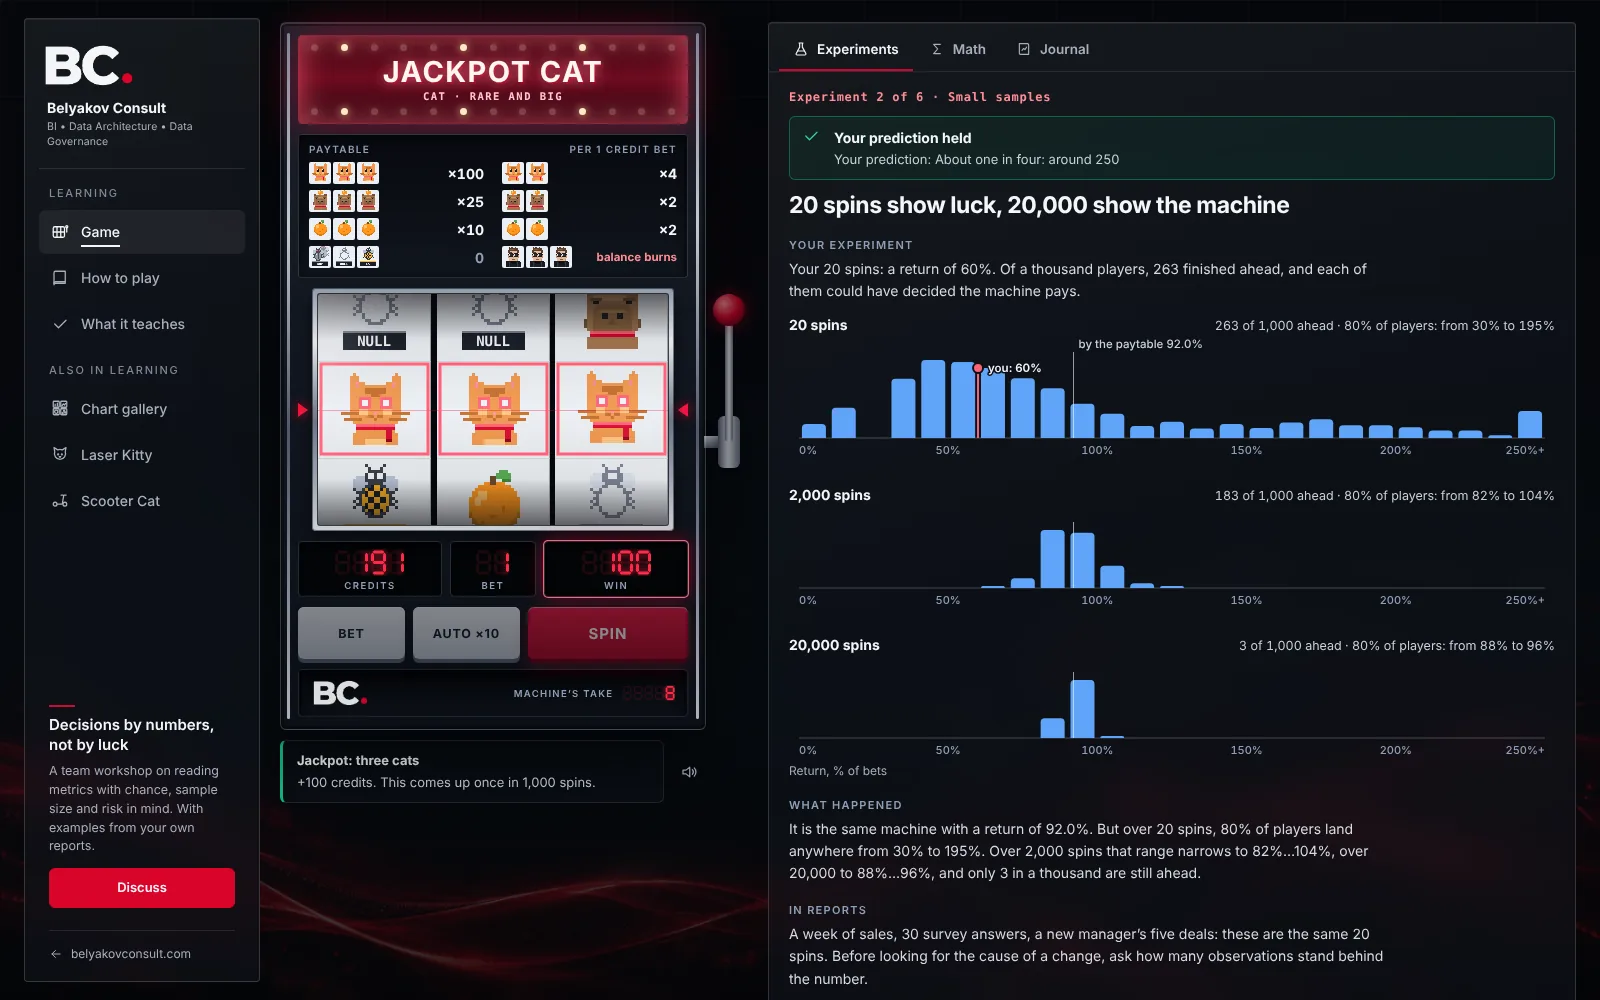
An 80s-style slot machine that hides nothing. Cats, capybaras and tangerines pay, data bugs (DUP, NULL, TEST) spoil the line, three matching bugs show a win that is not there, and three Data Bosses on the line mean an audit: the whole balance burns. A lever, ruby LED displays, bulbs and the sound of old machines, and behind the back panel the reel strips, the odds of every combination and the share the machine keeps: 8 credits of every 100. There is no money, no stakes and no prizes.
Six short experiments, each with a prediction first, then a few spins and then a debrief: what happened to you and to a thousand other players. The price of a spin (expected value: you win every fourth spin and still lose), small samples (after 20 spins one player in four is ahead, after 20,000 three in a thousand), reel memory (after five losses the odds are the same), the near miss (three matching symbols show up on screen 25 times more often than on the line), two machines with the same return and a different risk (Cat and Capybara), and Data Boss: a once-in-a-thousand event that reaches 63 players in a hundred over a thousand spins. Every experiment comes with a chart, a note on how the same trap looks in reports and an Excel tip. A Math tab with the table of odds, a journal with your result against the expectation, and the machine’s take. Buttons, a lever, the space bar and touch.
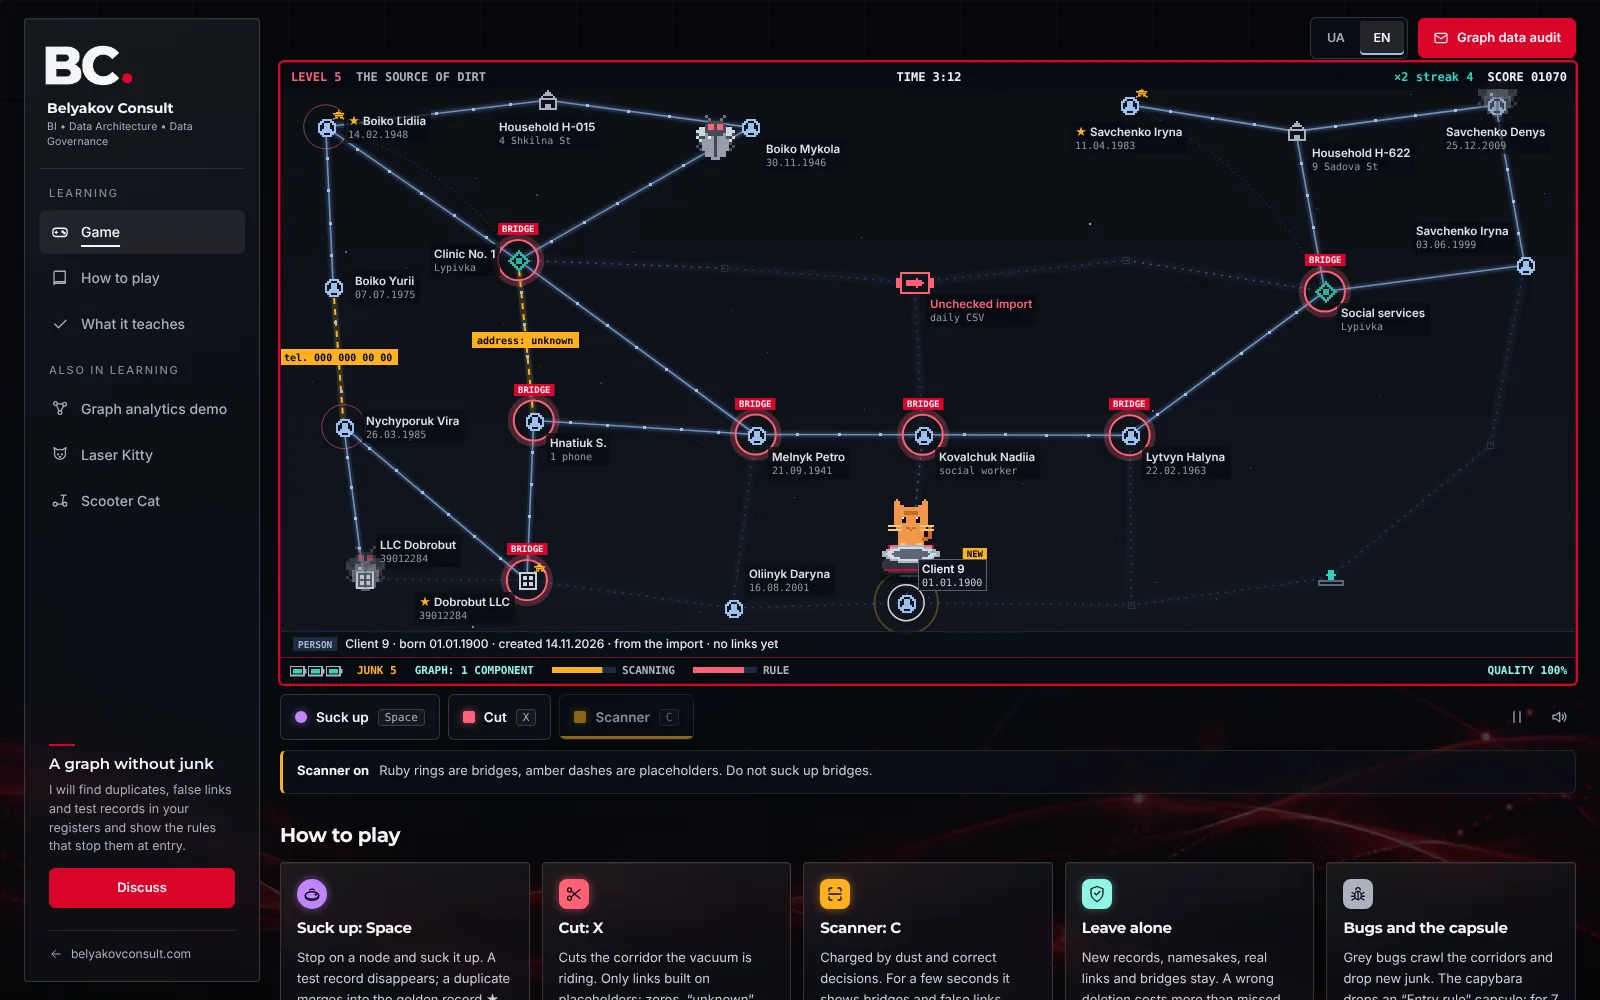
A Pac-Man style arcade where the maze is a relationship graph: people, households, clinics, social services and companies. The kitten from Laser Kitty rides a robot vacuum along the links, collects dust and decides on every record: suck up “TEST TEST”, merge “LLC Soniachnyi Lan” with the same company code into the golden record, cut a link built on “tel. 000 000 00 00”. A namesake with another birth date, a new record without links and a bridge node must stay, or the graph falls apart. Grey bugs crawl the corridors and drop new junk, and the capybara drops an “Entry rule” capsule.
Five levels: orphans, duplicates and namesakes, false links, bridges, and a source of dirt, an unchecked import that keeps adding junk until you seal it with an entry rule. A scanner shows bridge nodes and placeholders, and a component counter shows when the graph has split. After each level: the share of correct decisions, skills and an explanation of every mistake with a tip for doing the same in SQL, Power Query, NetworkX or Gephi; the decision log downloads as CSV. Calm mode without a timer, keyboard, swipe and touch controls. All data is synthetic.
The full data cycle on a 3D stage: from strategy, sources and registers through quality checks and the model to reports, people and decisions.
Registers, payments, services, data quality, analytical marts and management reporting. In these systems, a matching error or a weak indicator definition can quickly become a decision error.
Service planning has to combine health data, geography, facility networks, population need and accessibility. One average cannot explain the system.
Counting activities is not enough. An indicator has to connect to a source, a method, evidence and the decision the programme team makes from it.
Financial control becomes difficult when budgets, payments, donor funding, accounts receivable and reporting sit in separate files. The problem is usually not a lack of numbers. It is the lack of one traceable financial picture.
Internal business processes are often spread across many spreadsheets, emails and local reports. Management can see individual figures, but not always where a process is slowing down, what is overdue or where intervention is needed.
Nothing found. Try another word or reset the filter.

The full data cycle on one 3D stage: from strategy, sources and registers through integration, quality checks, the model and rules to analysis, reports, finance, management, geodata, users and results. At each stage you see what happens to a record and what it gives the organisation.
13 stages and 78 system components; a mode that walks you through every stage in turn; the text of each stage below the scene with links to services and Data Lab demos. The scene can be rotated and zoomed.

Registers, payments, services, data quality, analytical marts and management reporting. In these systems, a matching error or a weak indicator definition can quickly become a decision error.
The work included building analytics capability, corporate BI, data quality practices and analytical foundations for public information systems.

Service planning has to combine health data, geography, facility networks, population need and accessibility. One average cannot explain the system.
The focus has included geospatial analysis, network assessment, service accessibility, dashboards and data for rehabilitation planning.

Counting activities is not enough. An indicator has to connect to a source, a method, evidence and the decision the programme team makes from it.
Work with indicators, data verification, progress analysis, planning and reporting for programme and management teams.

Financial control becomes difficult when budgets, payments, donor funding, accounts receivable and reporting sit in separate files. The problem is usually not a lack of numbers. It is the lack of one traceable financial picture.
I bring financial flows, plan versus actual, donor funding sources, receivables and obligations into a single model. It can then support recurring reporting, variance analysis and practical control over the use of funds.

Internal business processes are often spread across many spreadsheets, emails and local reports. Management can see individual figures, but not always where a process is slowing down, what is overdue or where intervention is needed.
I build a common analytical model for plans and tasks, procurement, deadlines, team workload, operating cycles, KPIs and deviations. Data from different functions is brought into one management view that can be used regularly, not only at reporting time.