
Many tables, no common picture
Data sits in spreadsheets, registers or systems, but the measures do not yet add up to one defensible answer.

Data Analysis starts with a question, not a chart. We define the decision first, then prepare and test the data, look for patterns and check whether the conclusion survives scrutiny.
Data sits in spreadsheets, registers or systems, but the measures do not yet add up to one defensible answer.
The overall figure looks acceptable while specific groups, places or periods behave very differently.
The task is to examine factors, segments, relationships and anomalies rather than repeat the same number visually.
I do not use a complex method simply because it is available. The method has to fit the question, data quality and the cost of being wrong.
Define the decision to support and what a sufficient answer looks like.
Collect sources and test structure, quality and comparability.
Look for patterns, variance, segments and alternative explanations.
Test the conclusion against the data and document limitations.
Present the result in a form the team can use next.
Budget and actuals, variance, cash movement, revenue and cost structure, financial reporting logic.
Open serviceKPIs, trends, comparison across units or regions, delivery control and decision points.
Open serviceRegisters, services, payments, applications and other large datasets where record quality changes the conclusion.
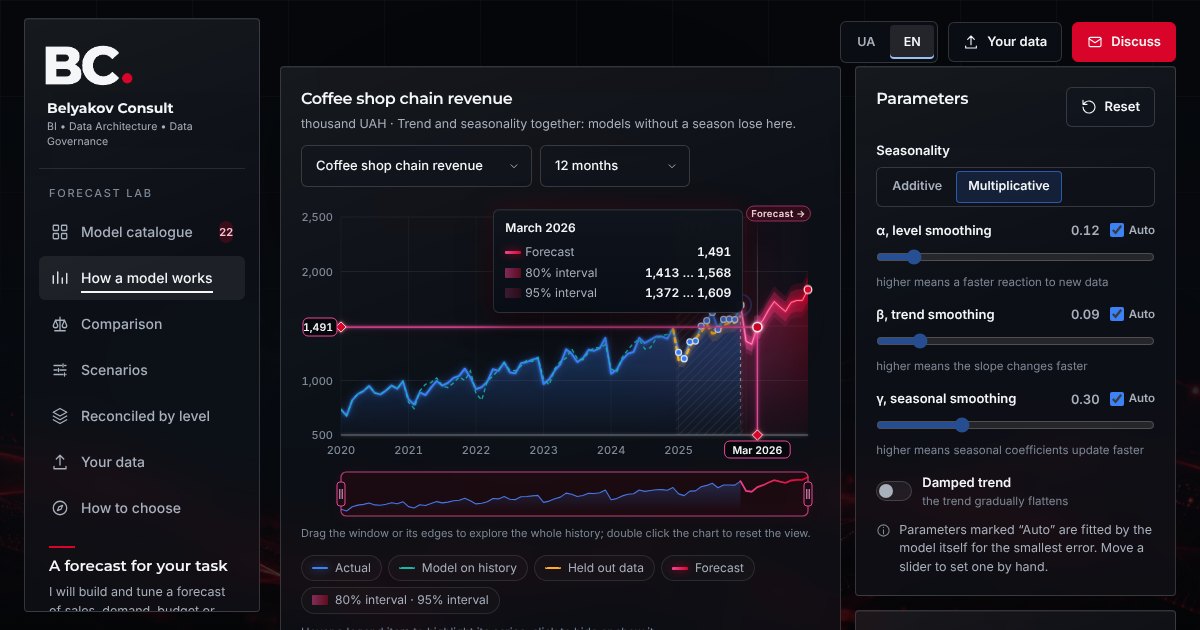 Forecasting models: how they work and a forecast on your data22 forecasting models from the naive forecast to Prophet, TBATS, SARIMAX and gradient boosting explained with SHAP: formulas, parameters, repeated accuracy testing, what if scenarios, a forecast reconciled across levels and a forecast on your own CSV or Excel file right in the browser.Open the demo →
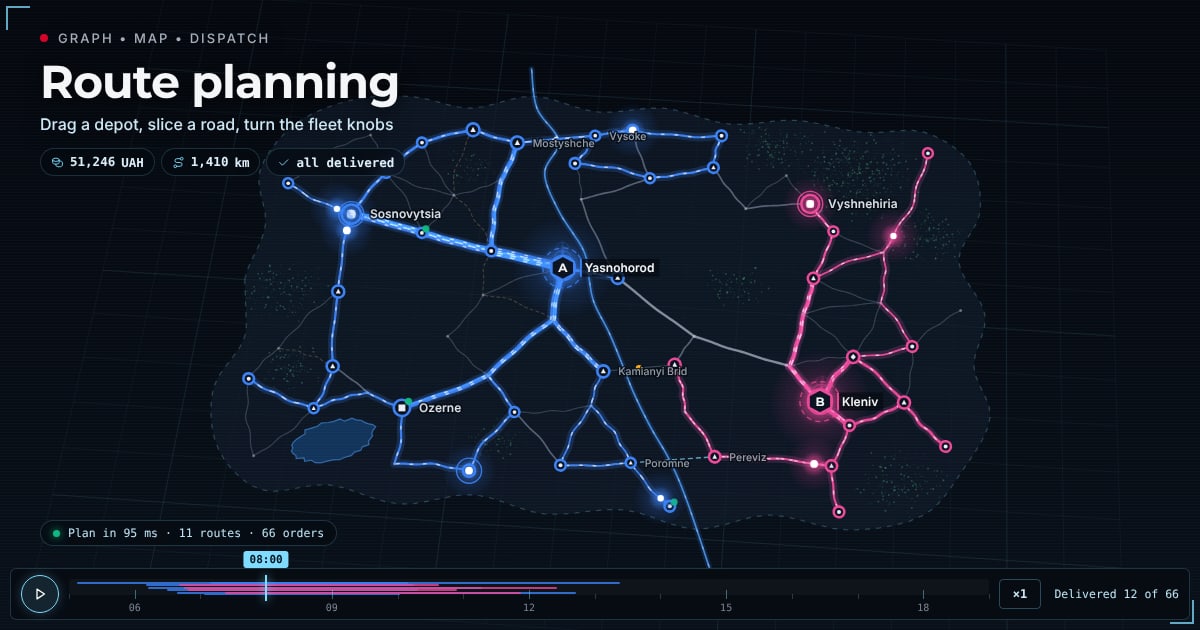 Logistics route planning demoAn interactive dispatch room on synthetic data: a road graph, a map and a route optimiser for two depots and 12 vehicles. Drag a depot, close a bridge, change the fleet and watch the plan rebuild.Open the demo →
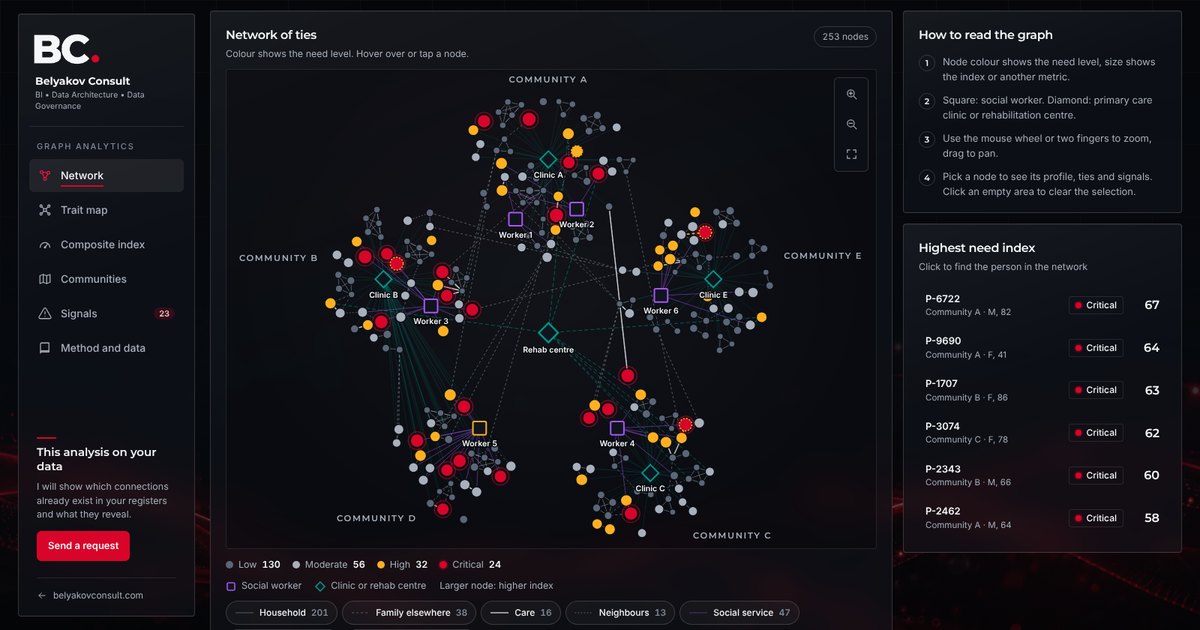 Graph analytics demoAn interactive graph on synthetic data: ties between people, demographic, social and medical characteristics, a composite need index and signals for social work.Open the demo →