
Each team sees only its own part of the picture
The indicators exist, but there is no common logic that allows comparison across teams, regions or programmes.
I build management analytics for internal enterprise processes. Plan and task execution, procurement, deadlines, team workload, operating cycles, KPI and deviations are brought into one model so leadership can see the state of the process and where action is needed.
The indicators exist, but there is no common logic that allows comparison across teams, regions or programmes.
Leadership receives several tables or presentations, but not a clear answer to what changed and where action is needed.
Data is collected manually, monitoring lags behind operations and the signal appears too late.
The goal is not to add one more dashboard. Management analytics should make internal enterprise processes visible, comparable and manageable.
We define which decisions the analytics must support and which signals are critical.
We agree KPI logic, breakdown dimensions, refresh frequency and roles.
We assemble the sources into one comparable indicator system.
We make sure the indicators are understood in the same way by all parties and match the sources.
The final view is delivered as a dashboard, report or short executive review.
Regular control of a programme, project or service without manual consolidation of many tables.
One consistent view across teams, offices, workstreams or territories.
Signals that help a manager quickly see a risk, a delay or a growth opportunity.
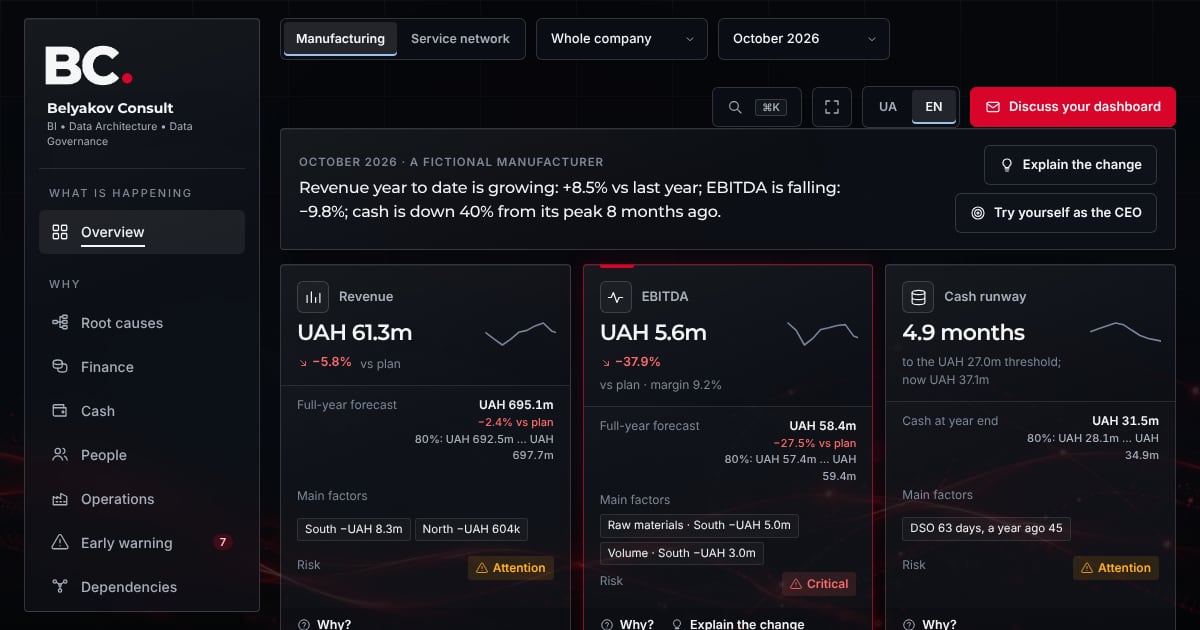 Executive dashboard demoAn interactive executive dashboard on synthetic data: five headline measures with a forecast, a root cause tree for the EBITDA gap, cash flow and a cash gap forecast, early warning, a dependency graph, a decision simulator and a Be the CEO challenge for manufacturing and a service network.Open the demo →
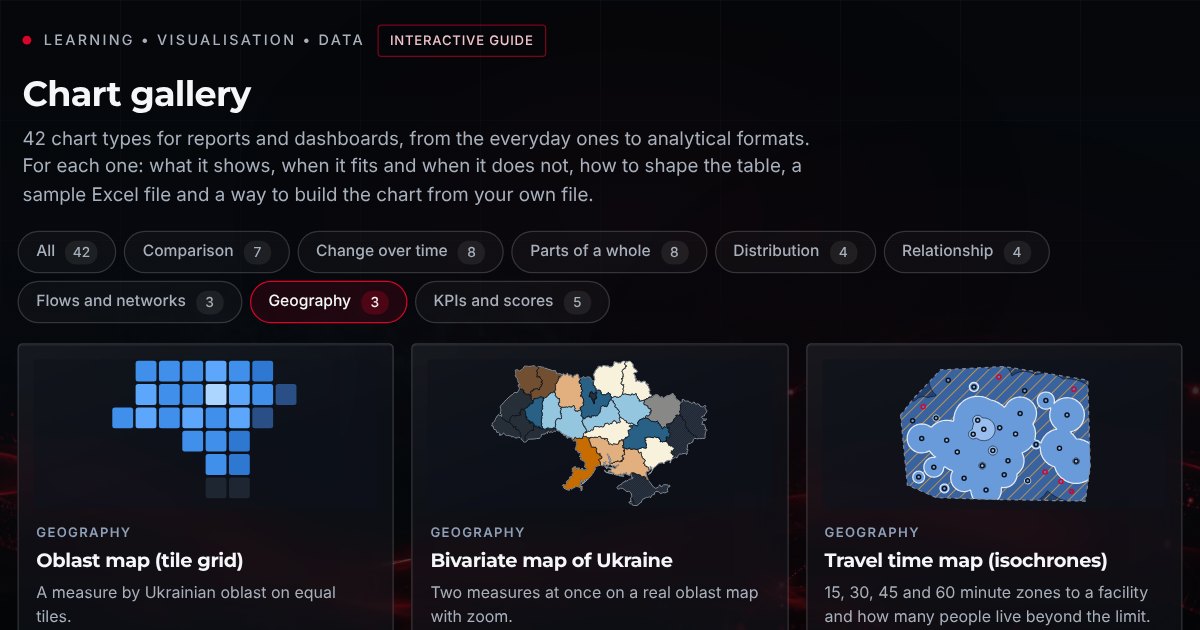 Chart gallery: 42 chart types explained42 chart types with guidance, tips and sample Excel data. Learn how to shape the table and build a chart from your own file right in the browser.Open the demo →
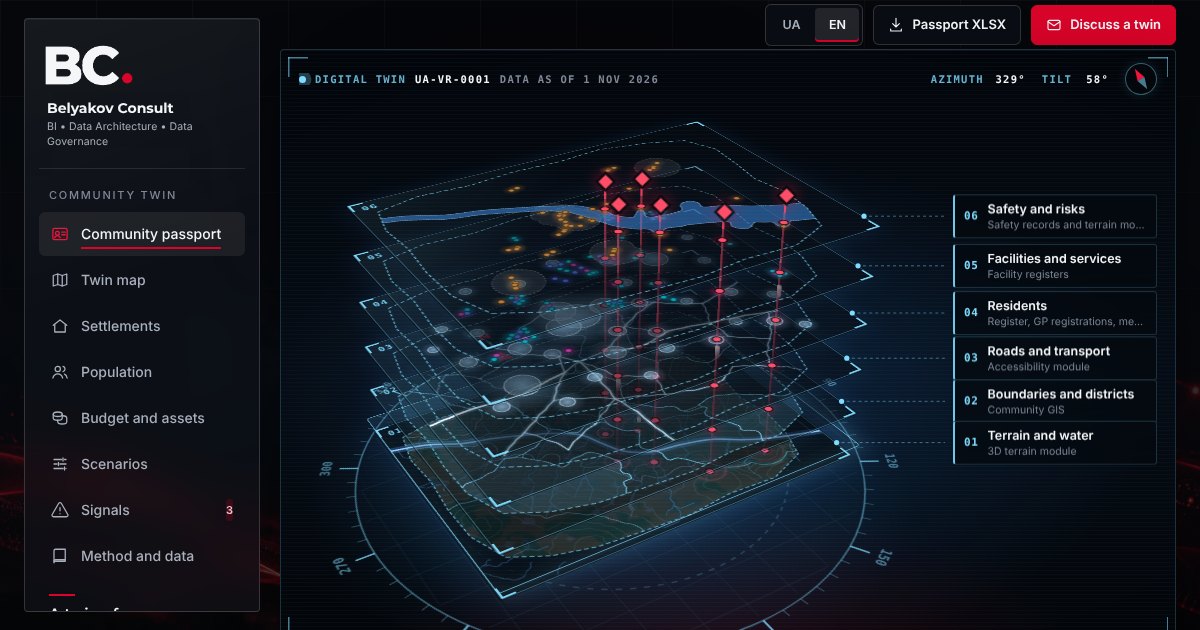 Community digital twin and passportAn interactive digital twin of a fictional community: a passport of 50 indicators with data status, a map of every register, a passport for each settlement, a resident count reconciled from three sources, budget and land, school network, blackout and flood scenarios, and signals on synthetic data.Open the demo →