
Plan and actuals live in different files
Financial data is scattered across Excel workbooks, tabs and manual summaries, so the overall picture remains fragmented.

I build financial analytics for controlling financial flows, donor funding, accounts receivable, plan versus actual, expenditure, balances and financial obligations. The data is brought into one model so the source of funds, movement, deadlines, deviations and risks can be traced.
Financial data is scattered across Excel workbooks, tabs and manual summaries, so the overall picture remains fragmented.
A report may show a gap between plan and actuals, while the drivers behind that gap remain unclear.
The team repeats the same steps every month and has too little time left to validate and explain the numbers.
Financial analytics should provide control, not just another report. Sources are first aligned into one structure, then the indicators are built to show cash movement, obligations, overdue items and deviations.
We define the financial decision that needs support and what level of precision is sufficient.
We collect files, forms and reference tables and check structure and compatibility.
We build a consistent logic for plan, actual, variance and related indicators.
We reconcile the result against source materials and document limitations.
The final view is delivered as a report, dashboard or briefing note.
Control of plan vs actual, expenditure dynamics, balances and meaningful deviations.
One structure for leadership, finance teams and programme managers.
A separate view on financing, cash gaps, investment activity and resource use.
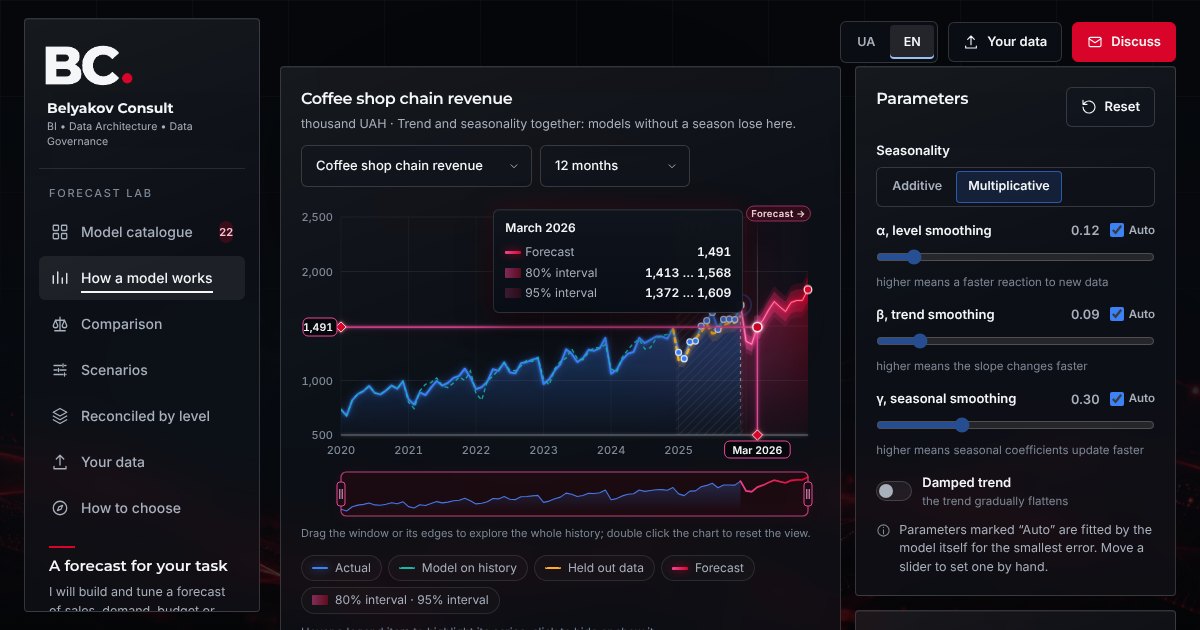 Forecasting models: how they work and a forecast on your data22 forecasting models from the naive forecast to Prophet, TBATS, SARIMAX and gradient boosting explained with SHAP: formulas, parameters, repeated accuracy testing, what if scenarios, a forecast reconciled across levels and a forecast on your own CSV or Excel file right in the browser.Open the demo →
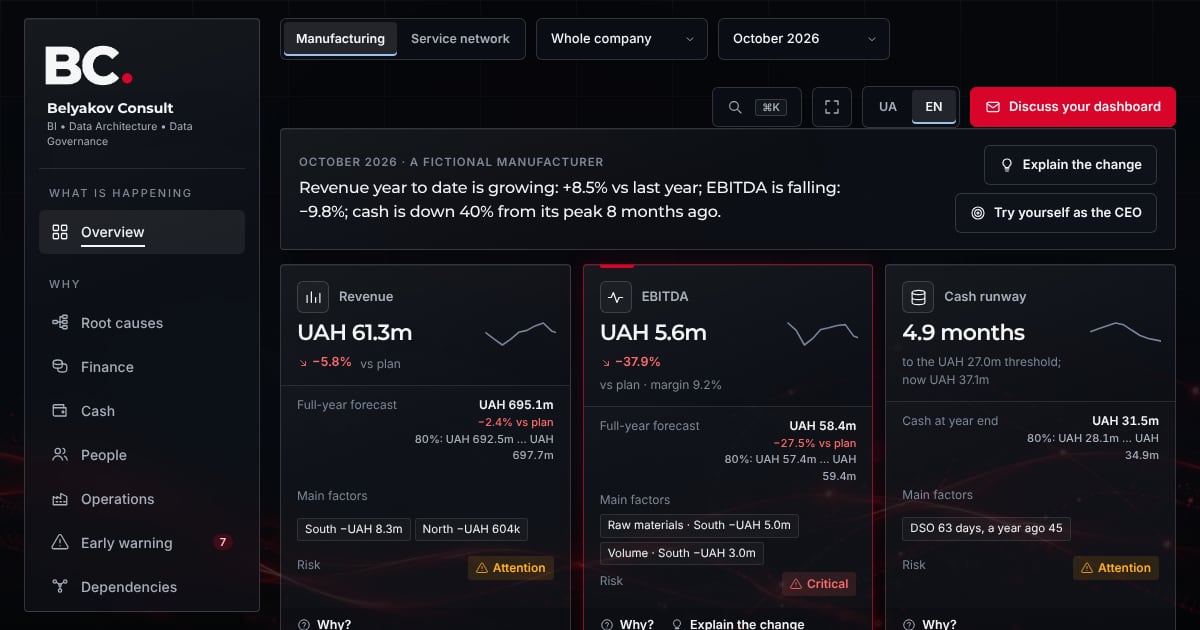 Executive dashboard demoAn interactive executive dashboard on synthetic data: five headline measures with a forecast, a root cause tree for the EBITDA gap, cash flow and a cash gap forecast, early warning, a dependency graph, a decision simulator and a Be the CEO challenge for manufacturing and a service network.Open the demo →
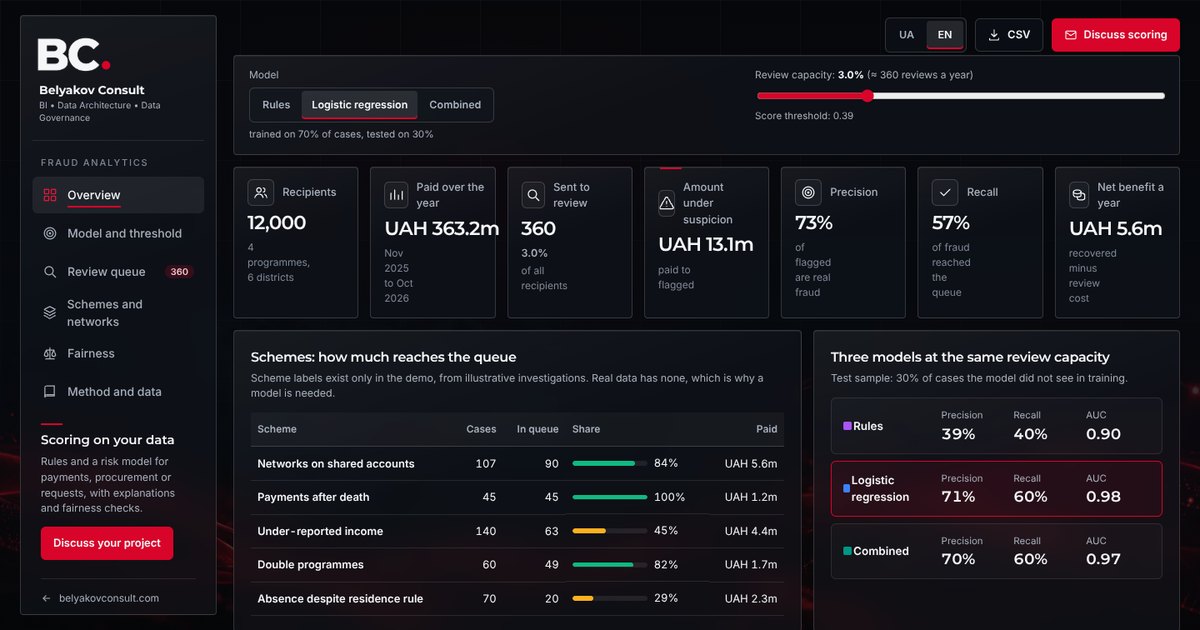 Social payment fraud analytics demoAn interactive fraud analytics demo on synthetic data: rules and logistic regression, threshold and review capacity, an explained review queue, networks on shared accounts and a fairness check of the model.Open the demo →