
Every report tells a different story
The same indicator is calculated from different sources or with different rules.

I build BI from indicator logic through to the dashboard. We agree what a number means and how it is calculated before deciding how it should look on screen.
The same indicator is calculated from different sources or with different rules.
Critical calculations live in manual files and refreshing a report depends on one person.
The screen is full of metrics, yet leadership still needs a separate explanation before acting.
The work starts with the indicator, not the chart. Source, formula, period, grain, owner and quality checks come first. That is what makes BI stable.
Agree what decision the report supports and who uses it.
Set formulas, sources, time periods and checks.
Replace manual joins with a stable analytical model.
Keep only what helps someone see status, deviation and the next action.
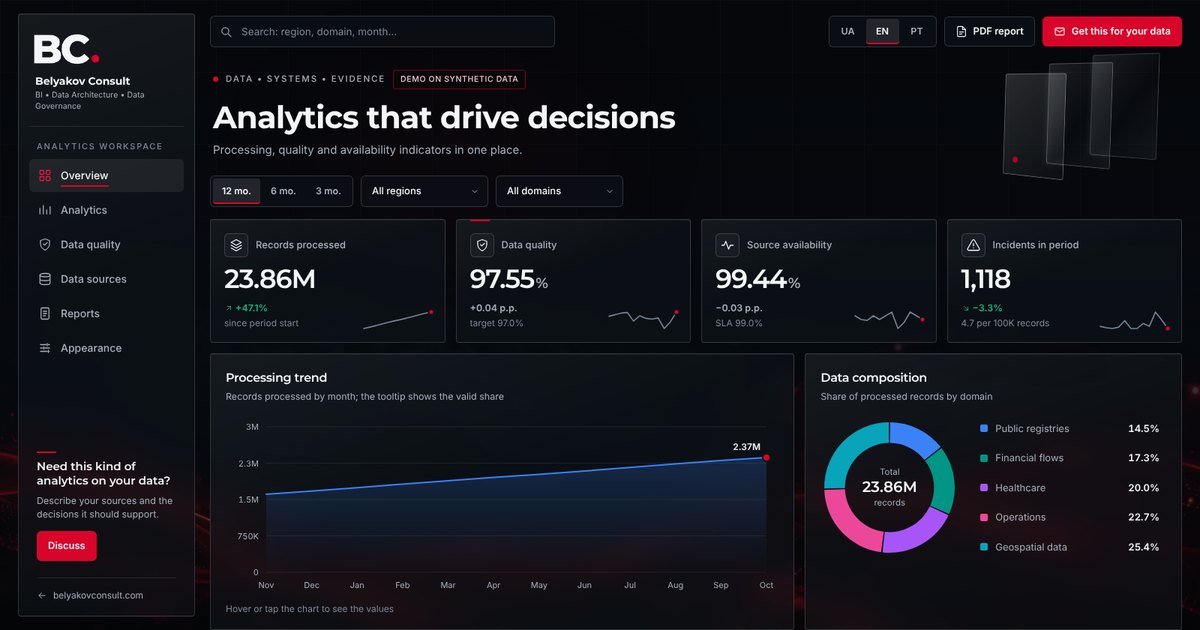 Data quality dashboard demoAn interactive BI dashboard on synthetic data: quality, sources, regions and a one-minute PDF report. An example of Belyakov Consult analytics work.Open the demo →
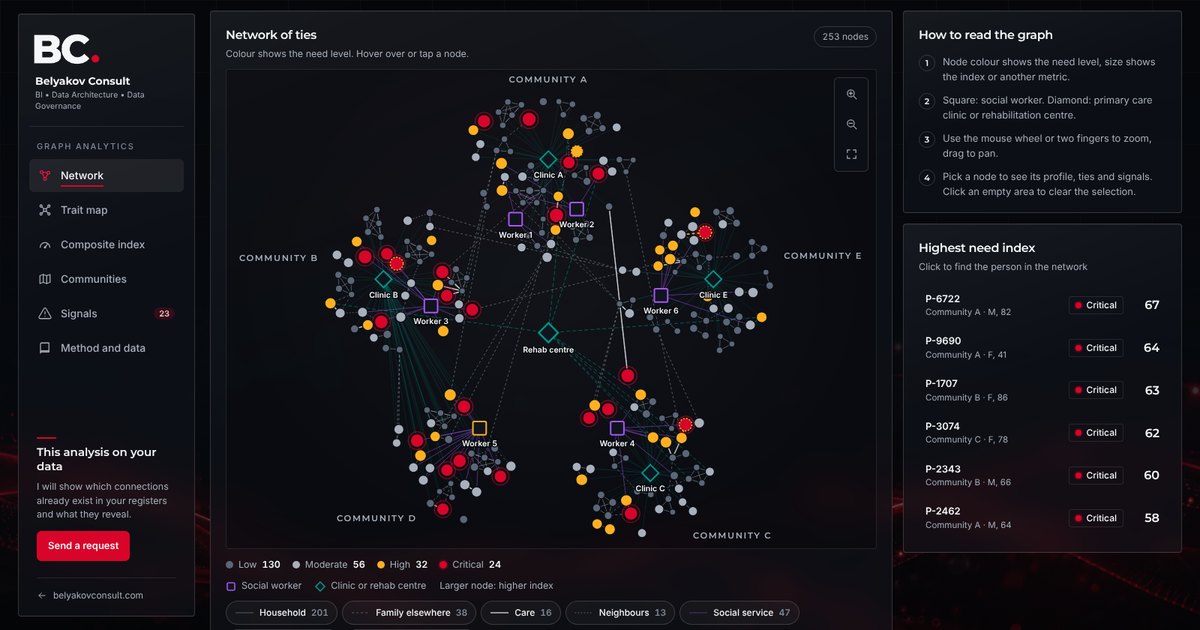 Graph analytics demoAn interactive graph on synthetic data: ties between people, demographic, social and medical characteristics, a composite need index and signals for social work.Open the demo →
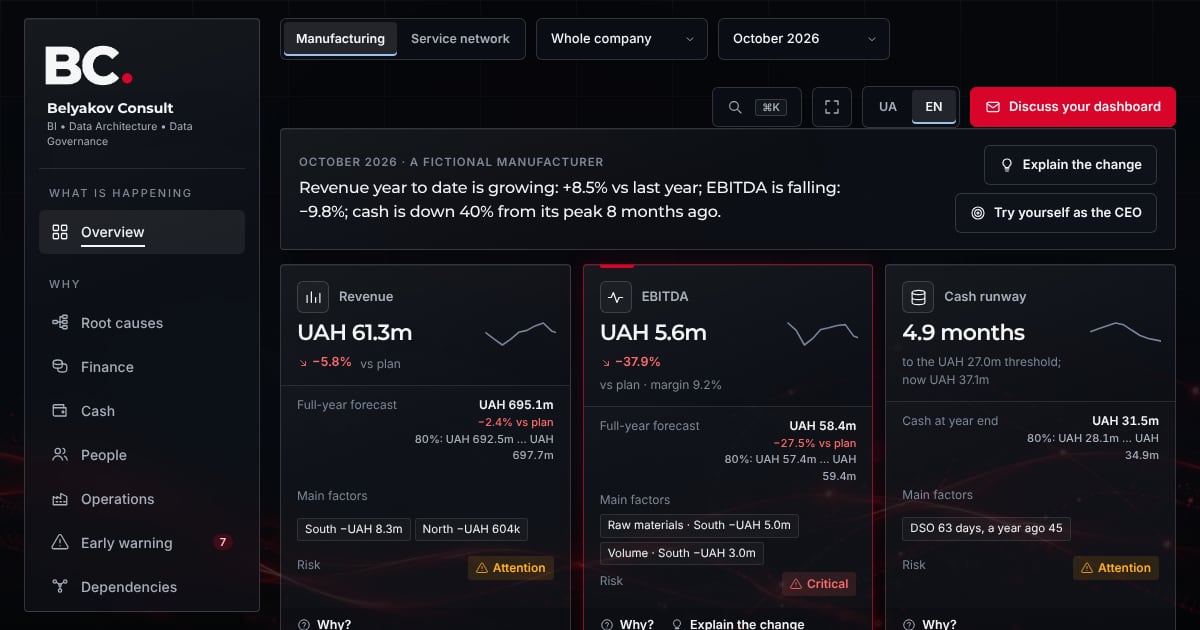 Executive dashboard demoAn interactive executive dashboard on synthetic data: five headline measures with a forecast, a root cause tree for the EBITDA gap, cash flow and a cash gap forecast, early warning, a dependency graph, a decision simulator and a Be the CEO challenge for manufacturing and a service network.Open the demo →