
Finding the source of a metric takes detective work
A report depends on several tables, files and transformations that are not documented.

Architecture is not a diagram for its own sake. It should explain how data moves from a source system into an indicator, a report, an exchange or an API.
A report depends on several tables, files and transformations that are not documented.
Every new exchange introduces its own formats, identifiers and business rules.
Dashboards spend their time cleaning and stitching data instead of using a prepared analytical model.
I look at architecture from both ends. How the systems work today and how leadership expects to use the result. The target design has to connect those two realities.
Map sources, exchanges, tables, reports and dependencies.
Separate business entities from their current technical implementation.
Design integration, storage, marts and BI layers.
Sequence change without breaking the processes the organisation still relies on.
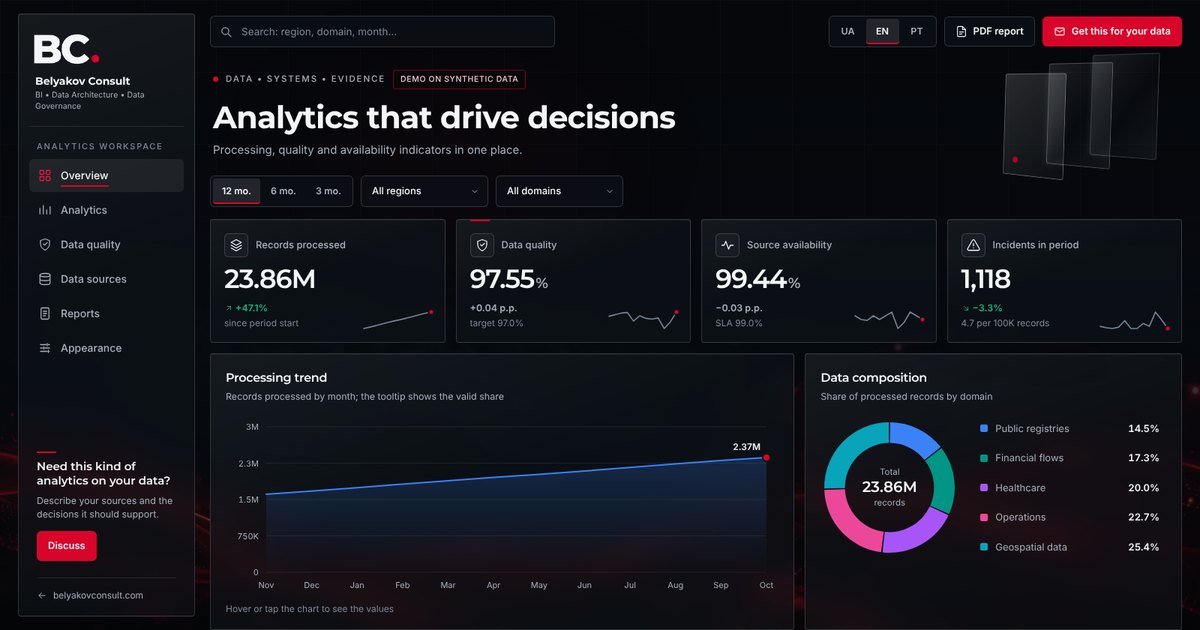 Data quality dashboard demoAn interactive BI dashboard on synthetic data: quality, sources, regions and a one-minute PDF report. An example of Belyakov Consult analytics work.Open the demo →
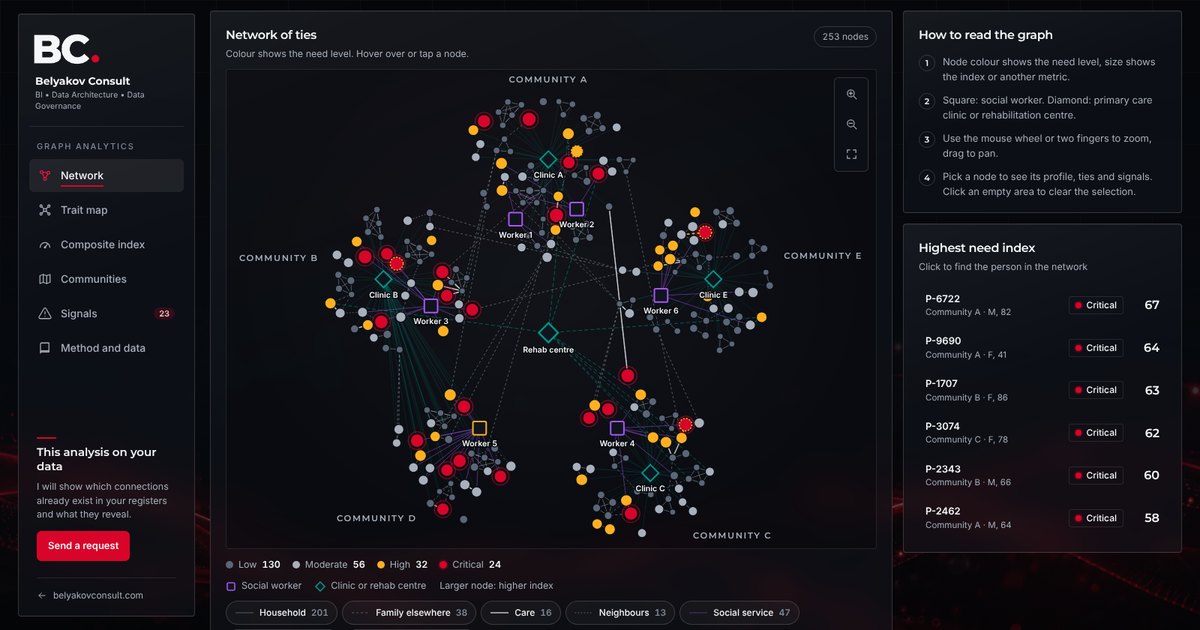 Graph analytics demoAn interactive graph on synthetic data: ties between people, demographic, social and medical characteristics, a composite need index and signals for social work.Open the demo →
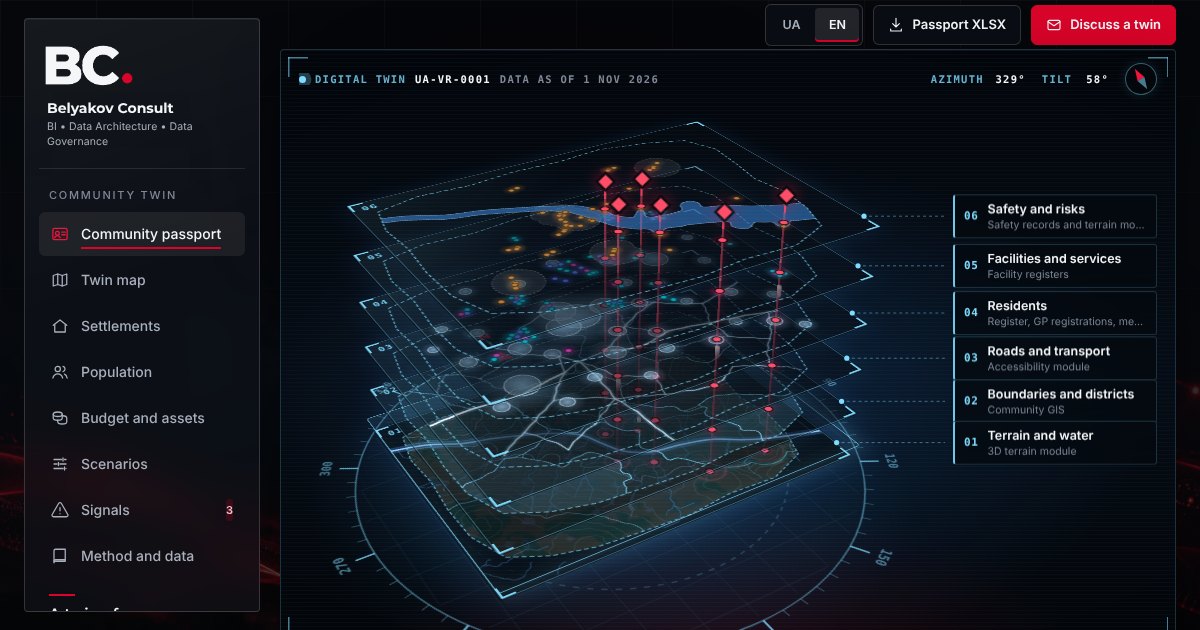 Community digital twin and passportAn interactive digital twin of a fictional community: a passport of 50 indicators with data status, a map of every register, a passport for each settlement, a resident count reconciled from three sources, budget and land, school network, blackout and flood scenarios, and signals on synthetic data.Open the demo →