
A field is filled but the value is wrong
Completeness alone does not make data usable. Dates, codes, documents and addresses can be populated and still fail the business rule.

Data quality is not one abstract percentage. The useful question is which errors can change a payment, coverage estimate, report or management conclusion.
Completeness alone does not make data usable. Dates, codes, documents and addresses can be populated and still fail the business rule.
The same person, organisation or event appears in several records and distorts coverage or value.
Quality control sits at the end of the process. It needs to move closer to data capture and exchange.
I do not start with a catalogue of one hundred checks. We first identify the fields and scenarios where an error changes money, access, identity or reporting.
Identify where an error actually changes the outcome.
Inspect values, formats, missingness, duplicates and distributions.
Turn business requirements into checks that can be automated.
Make clear who sees the issue, who fixes it and how the result is verified.
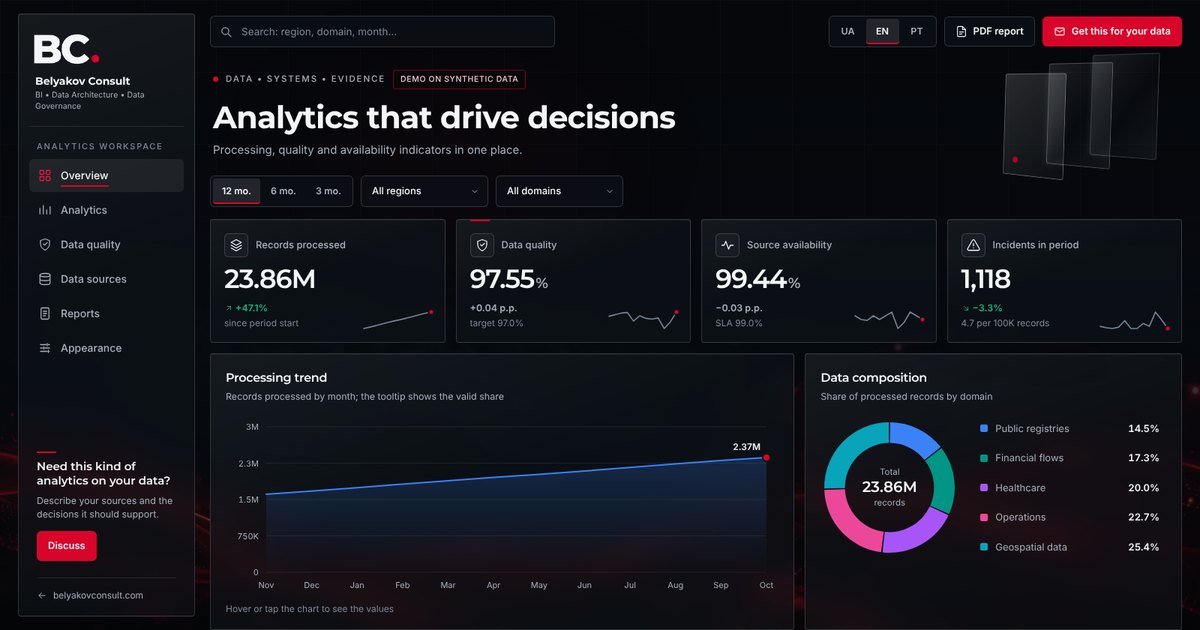 Data quality dashboard demoAn interactive BI dashboard on synthetic data: quality, sources, regions and a one-minute PDF report. An example of Belyakov Consult analytics work.Open the demo →
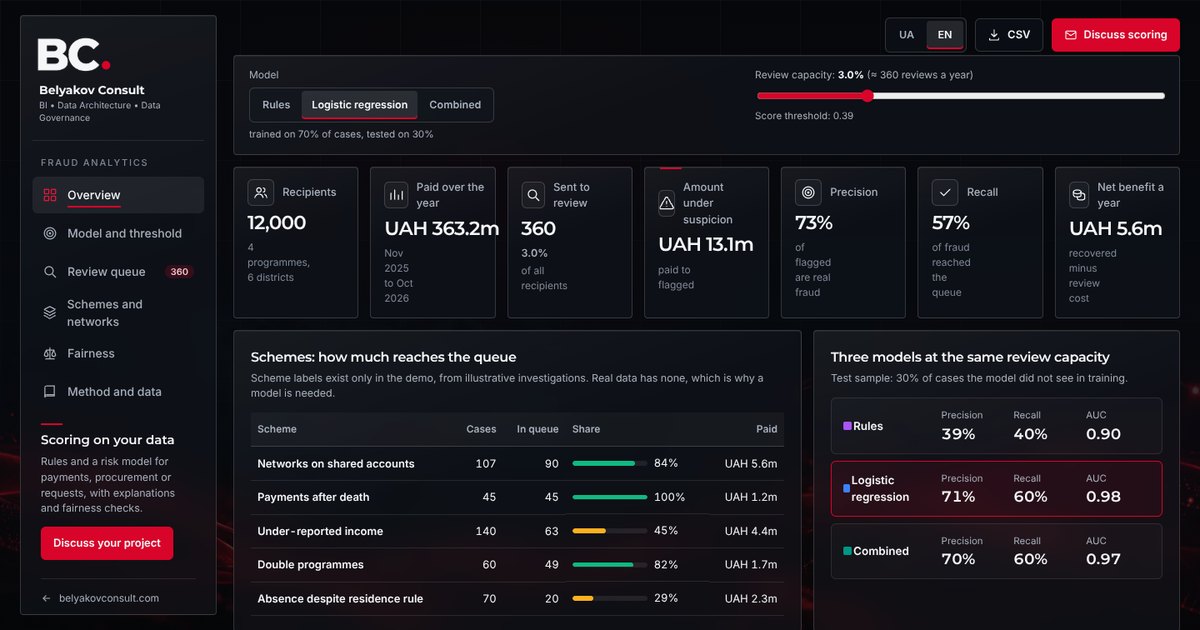 Social payment fraud analytics demoAn interactive fraud analytics demo on synthetic data: rules and logistic regression, threshold and review capacity, an explained review queue, networks on shared accounts and a fairness check of the model.Open the demo →
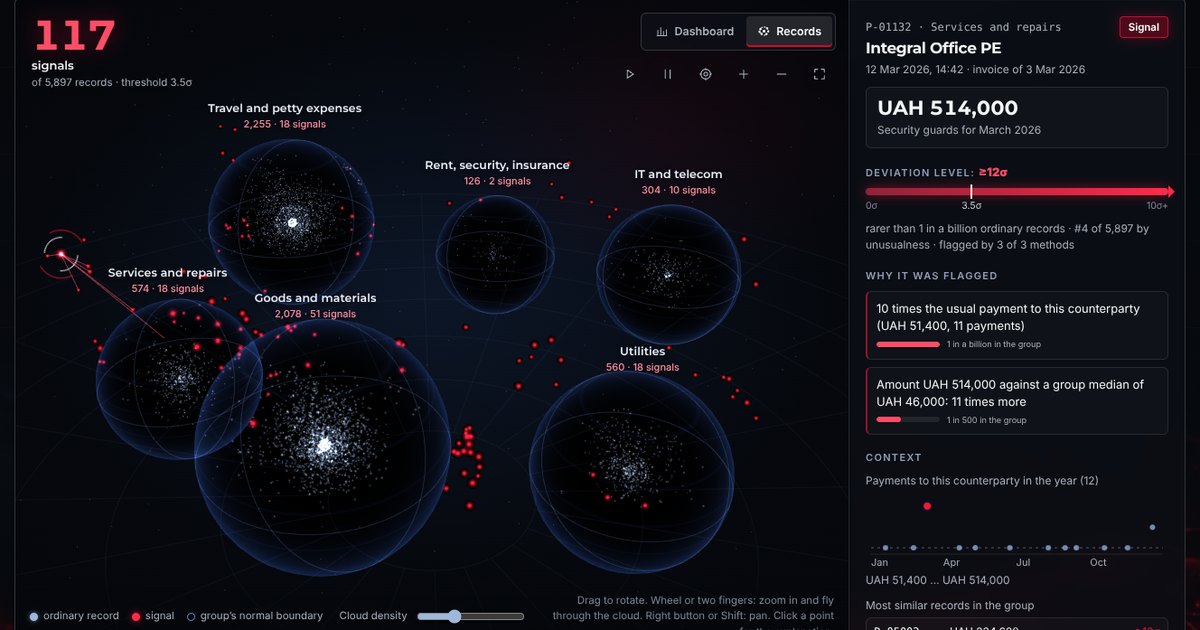 Anomaly detection demoAn interactive 3D cloud of almost 6,000 payments: anomalies a regular dashboard cannot show, three detection methods, a sensitivity threshold, an explanation for every signal and anomaly search in your own CSV or Excel file right in the browser. Synthetic data.Open the demo →