
One indicator has several “correct” values
Teams use different formulas, periods or sources and end up with incompatible numbers.

Good governance answers very ordinary questions. Who sets the rule. Who fixes an error. Which source is authoritative. Who approves a change.
Teams use different formulas, periods or sources and end up with incompatible numbers.
There is no data owner or data steward with the authority and responsibility to take the problem through to resolution.
Definitions, exceptions and calculation logic disappear when the team changes.
You do not judge governance by the number of policies. You see it when there is a conflict. The team knows who decides, which rule applies and where that logic is recorded.
Identify critical domains and the people who can actually make decisions.
Agree terms, indicators, rules and authoritative sources.
Define how an error, rule change, access request or escalation moves through the organisation.
Start with the most critical data and expand the model once it works in practice.
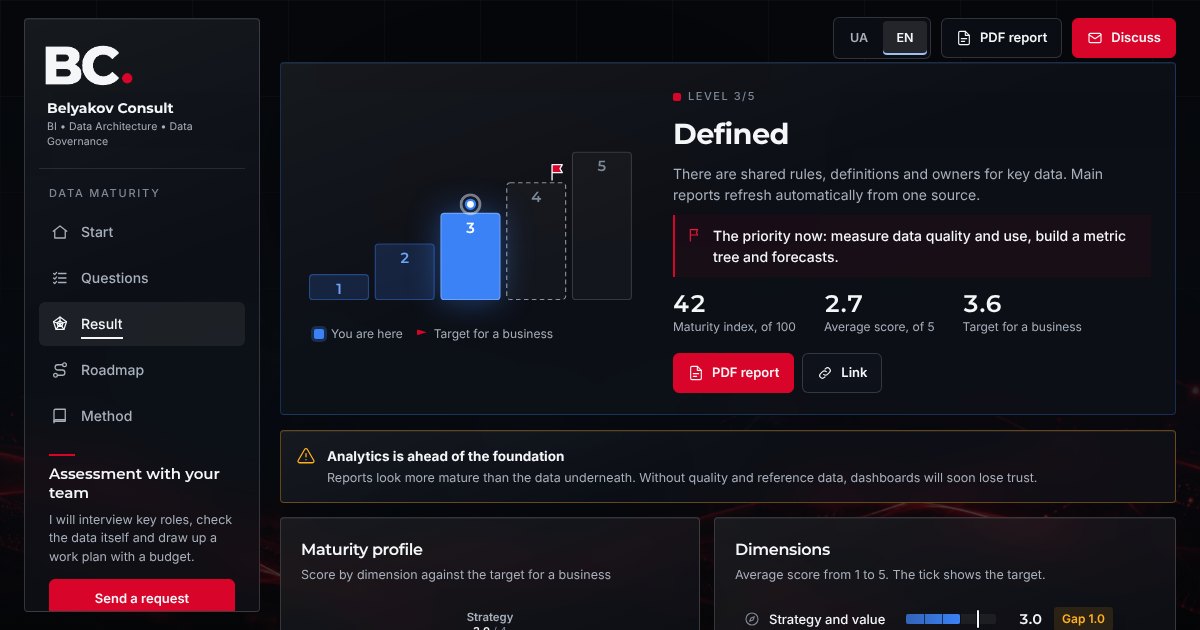 Data maturity assessment for organisations: a free self checkAssess how mature your work with data is in about 10 minutes: 32 questions in eight dimensions from strategy and governance to quality, reference data, analytics, people and security, a level from 1 to 5, strengths and gaps, a 30, 90 and 180 day roadmap and a PDF report. Your answers stay in your browser.Open the demo →
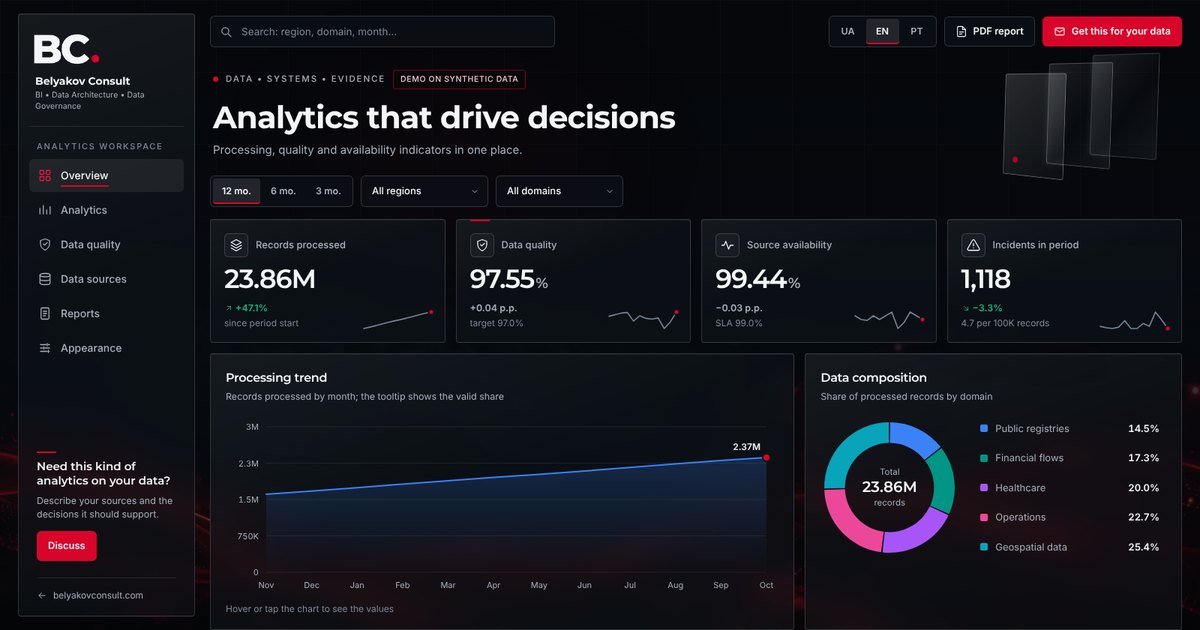 Data quality dashboard demoAn interactive BI dashboard on synthetic data: quality, sources, regions and a one-minute PDF report. An example of Belyakov Consult analytics work.Open the demo →
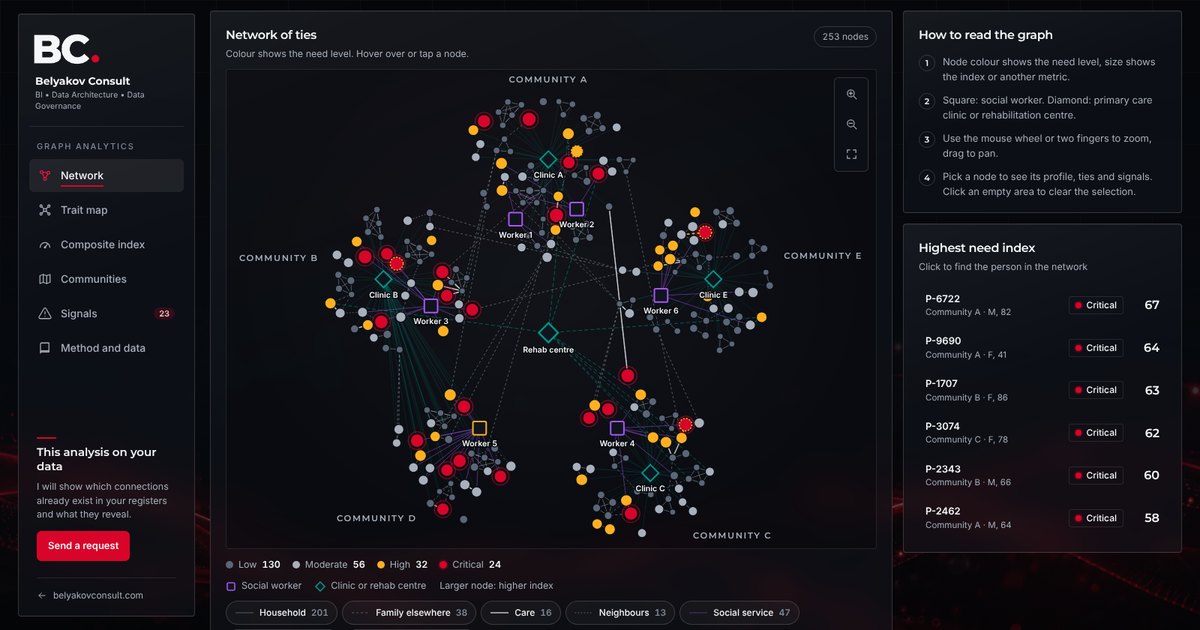 Graph analytics demoAn interactive graph on synthetic data: ties between people, demographic, social and medical characteristics, a composite need index and signals for social work.Open the demo →