
An average hides the local gap
A region can look well supplied while individual communities remain far from the service they need.

Geospatial analysis shows where a service exists on paper but is difficult to reach in practice. Distance, travel time, demand, capacity and service areas tell a different story from a regional average.
A region can look well supplied while individual communities remain far from the service they need.
People use roads and transport, not statistical borders. Travel time can matter more than straight line distance.
Demand, current supply, accessibility and workload need to be compared in the same geography.
A map is not analysis by itself. I combine spatial data with demand, capacity and outcome measures so places can be compared and the reasoning can be explained.
Check addresses, coordinates, boundaries and spatial quality.
Add population, workload, demand and relevant context.
Calculate distance, travel time, coverage or the measure that matches the real use case.
Compare places and show where a change is likely to have the largest effect.
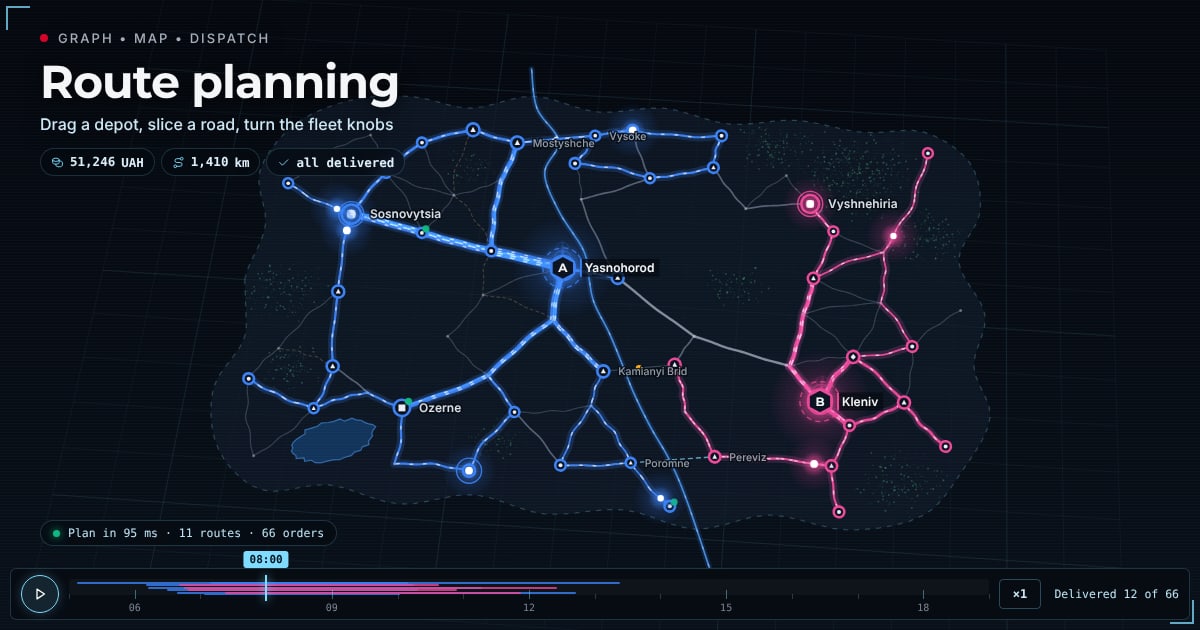 Logistics route planning demoAn interactive dispatch room on synthetic data: a road graph, a map and a route optimiser for two depots and 12 vehicles. Drag a depot, close a bridge, change the fleet and watch the plan rebuild.Open the demo →
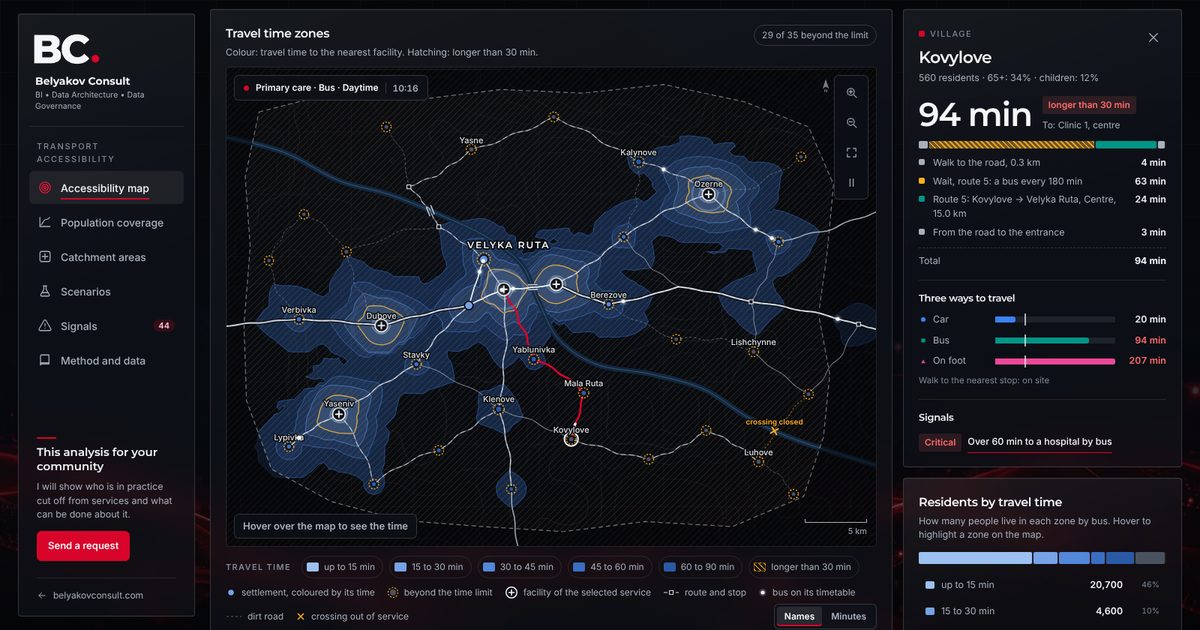 Transport accessibility analysis demoAn interactive isochrone map on synthetic data: travel time to primary care, a hospital and an administrative service centre by car, by bus and on foot, population coverage, catchment areas, scenarios and signals.Open the demo →
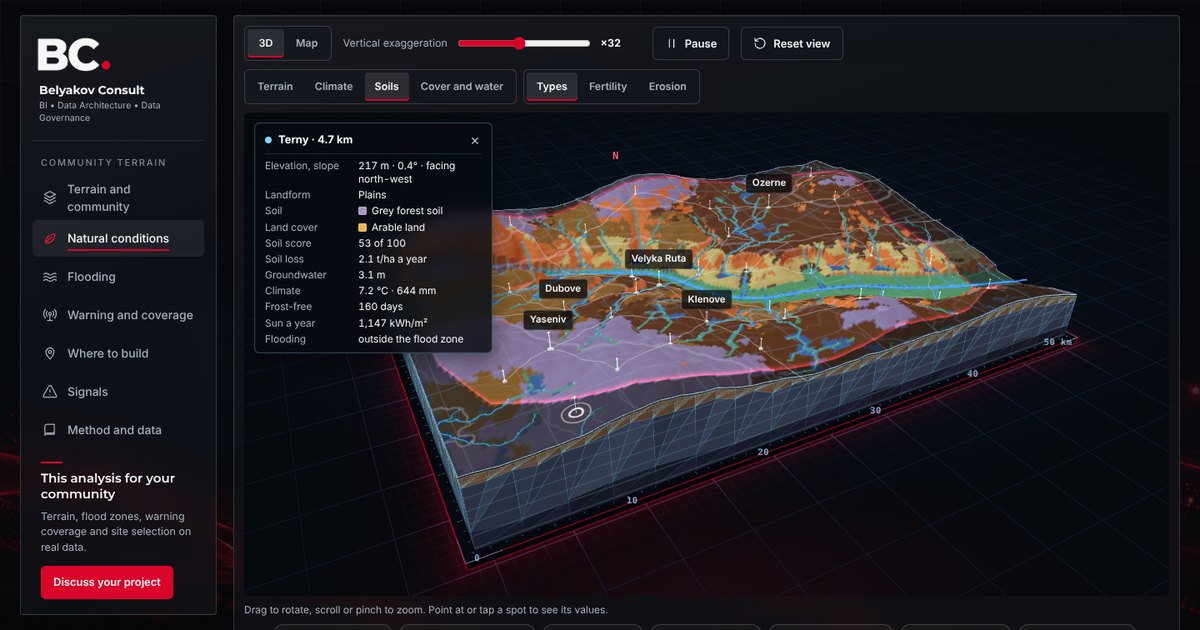 Community terrain 3D demoAn interactive 3D terrain model of a fictional community: flood zones and flood recurrence, cut-off villages, siren and telecom coverage, climate, soils, erosion and groundwater, site selection and risk signals on synthetic data.Open the demo →